

If the past 20-odd years (essentially since China entered WTO) can be characterised by a so-called ‘savings glut’, the future will more likely be a feature of a ‘capital thirst’. That means interest rates could be higher than current levels – scarce capital. The present, though, is a result of an extraordinary increase in US interest rates within a short period of time, something that has happened only once in modern history, in the late 1970s.
The US Treasuries (UST) have lagged in performance lately to a much worse extent (from a total return point of view) than during Paul Volcker’s epoch, while risk assets have performed much better. As much as we do not like joining a consensus, we agree that “something ‘has’ to break”, thus sending US treasury yields lower – scared capital.
UST Outperformance
There are many reasons for the rise in USTs, but they can be roughly put under these three headings:
– Hawkish Fed = Higher Terminal Rate;
– Cautious Buyers = Higher Term Premium; and
– Not-so-cautious Government = Higher Net Issuance.
The Fed is hawkish because inflation is elevated due to strong growth, employment is, so far, booming, and some other economic data has pointed in this same direction. Buyers are cautious, however, because they face negative carry and/or exorbitantly high USD-hedging costs. They worry about the “deterioration in governance quality” undermining the U.S. political system’s integrity, with negative implications for the “institutions in managing the economy and absorbing adverse shocks”, as Fitch Ratings1 puts it. As a consequence, of this not-so-cautious government (i.e. weak governance) we see higher UST issuance. Notice the vicious cycle?
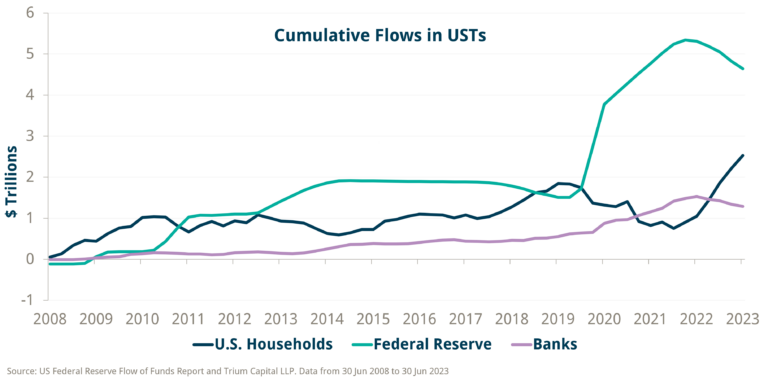
In other words, we think there is a structural shift in the demand and supply of USTs, from price-insensitive marginal buyers to price-sensitive ones – a trend which we think is here to stay. On the demand side, since 2008, the main buyers have been the Fed due to quantitative easing (QE), commercial banks in the process of meeting Basel III regulatory requirements for high-quality liquid assets (HQLA), and other foreign Central Banks and Sovereign Wealth Funds (SWFs) as they build up their foreign cash reserves. All of these are price-insensitive.
The chart below shows that two of these, Banks and the Fed, have turned into sellers, rather than buyers, in the last two years (foreign Central Banks/SWFs have too – as illustrated by the Treasury International Capital (TIC) System2). The marginal buyers, instead, have become US households and leveraged accounts (home and foreign-based hedge funds). The problem, though, is that they are price sensitive – they will buy USTs but may demand a discount.
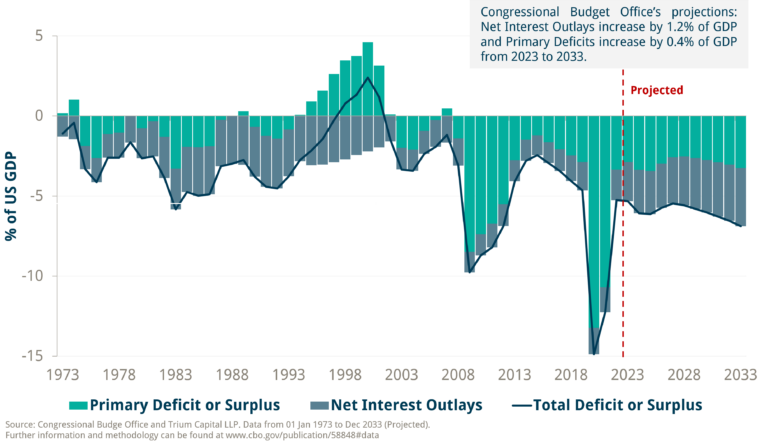
On the supply side, courtesy of the very high debt stock and the recent rise in UST yields, the US Government is running a record high interest rate expense to GDP. The problem, though, is that in parallel, the US also has a very high primary deficit, which, according to the Government’s own projections, is likely to stay high going forward. This is quite unprecedented, and it means that net issuance of USTs is likely to rise, not fall, in the future.
The US Government is not the only one which will demand scarce capital in the future, though. The private sector is bound to follow, especially when its refinancing needs resurface soon (whether that is US households or US corporates – we think this is a 2024-2025 story). But there is a much bigger shift in the demand for capital globally, which comes from three different sources:
1) The need to build the economy of tomorrow, whether that is green energy, high-end manufacturing, or Artificial Intelligence;
2) The need to redirect global supply chains away from ‘unfriendly’ countries; and
3) The need to fund a tide of rising global conflicts and wars as well as the subsequent infrastructure rebuilt.
All these will require huge amounts of capital, which is likely to underpin global interest rates higher than current levels.
UST Underperformance
Before this week, the UST market had gone through 11 consecutive weeks of yields closing higher, a modern record. If yields close at these levels, the total return on USTs will be negative for a third year in a row – also a record. It is not just the magnitude of the increase in UST yields, but the move higher combined with the time it took to accomplish it, which is unprecedented.
The chart below breaks down the move in nominal yields (higher) between Breakevens and Real Rates. Generally speaking, when the main driver is Breakevens, the implication is that inflation is on the rise because growth prospects are better. Meanwhile, risk assets (we use Emerging Markets/EM sovereign spreads as a proxy) do well. If it is Real Rates, meaning the Central Bank is probably in the midst of a policy mistake, risk assets do not do well.
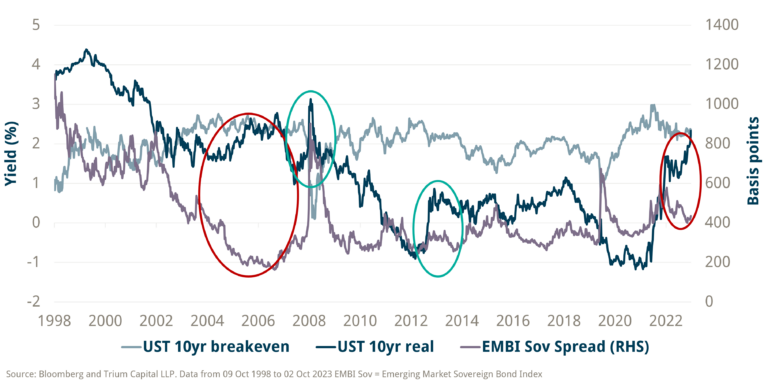
At the start of the move higher in US rates this summer, it was Breakevens in the driver’s seat, but in August and onwards, the main driver has been Real Rates. Yet, risk assets not only did not sell off in the latter stage but even continued to rally. As a result, there appears to be a large disconnect between real rates and risk assets, which happened only one other time in the past – before the 2008 financial crisis. Back then, the divergence was closed, with risk assets selling off and rates going lower.
Risk in financial markets is a bit like energy in life – it does not magically disappear; it only transfers from one state/entity to another. More than a decade of QE has changed the financial landscape but not its underlying structure. Now that it is over, once its lagged effects wear off, risk will resurface; we just need to guess where.
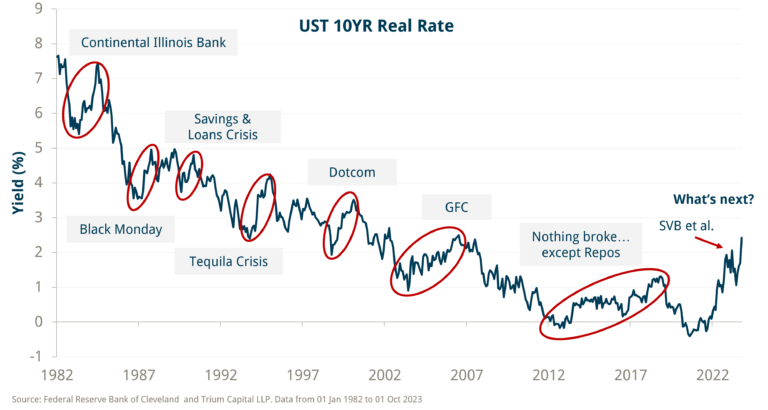
The chart below shows that every single time Real Rates rose with a similar magnitude over time, ‘something broke’. To a certain extent, we went through a similar event in March this year with the US regional banking crisis. However, after a short dip in rates and selloff in risk assets, the trend of higher rates and bullish risk assets continued. We think the ‘something breaks’ moment is still ahead of us. We think, though, that if it were to happen in the short term, unlike in the 2000 or 2008 crisis, the underlying cause of it wouldn’t be the private sector (private assets underwater) but rather the government sector (sovereign bonds).
It is still the same script, though – a financial institution of ‘significantly important magnitude’ (though probably not a bank this time) having to eventually mark to market assets that have gone ‘underwater’ (note, the 2012 European sovereign bond crisis was similar, though the issue with USTs is not one of sovereign solvency, like it was with Greece, for example). If banks did not change their securities portfolios in time before the spike in interest rates (in fairness, after more than a decade of Zero Interest Rate policy and low vol, perhaps no risk model would have picked this up), what chance did other investors have? How many of them are still operating under an allocation strategy which assumes a negative correlation between stocks and bonds, terminal Fed Funds of 2.5%, interest rate volatility below equity volatility, etc.? How many are still running passive portfolios attuned to a completely different financial regime?
Our view here is that the correlation between bonds and stocks has probably changed to positive, but it is risk assets which have the catching up to do after the recent UST selloff, which may, indeed, temporarily move the correlation to negative, like in the classic risk-off events of the past.
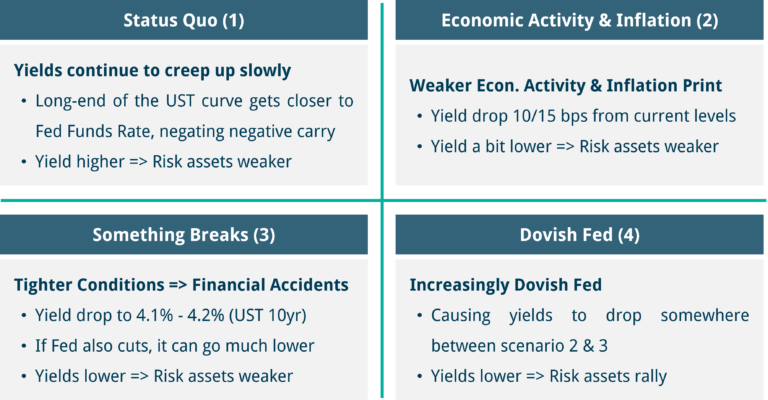
We see four potential scenarios for the short-term going forward