

Dragons are important in China, being the only mythical creature that has found a place in the Chinese zodiac. In Chinese folklore, the years of the Dragon (2024 and every preceding 12 years) are associated with good fortune and success. In contrast, the years of the Tiger (2022) and Rabbit (2023) were not particularly good for Chinese households, who saw their wealth plummet on account of the collapse of both real estate prices (the largest item on their balance sheet by far) and stock prices. On top of that, their massive savings earned less and less as deposit rates collapsed. The years of the Rat (2020) and Ox (2021) were not particularly good either – due to COVID-19, they were characterised by strict lockdowns. Lockdowns, drawdowns… a lot has happened in China, and the thoughts on investors’ minds for 2024 is: Will the Year of the Dragon deliver?
As investors, the one country we cannot ignore is China. The country is such a vital part of the global supply chain, world GDP, world trade, and world geopolitics that it will likely affect all investments. What has happened lately, and 2023 was the tipping point, is that investors not only exited China, but it seemed they stopped caring about it. Not only have Chinese assets become idiosyncratic in nature (no correlation or, at times, negative even to DM/EM), but some commodities have recently traded counterintuitively to Chinese economic data (copper and oil in particular).
For investors still involved, though, the current crisis brings memories of the 2015-16 market turbulence. There are undoubtedly many similarities to today but also many differences. Nevertheless, investors seem particularly keen to follow the 2015-16 playbook when it comes to FX and the equity market. We do not think that this is such a good idea.
China does not favour a weaker Renminbi (CNY).
On the margin, a weaker CNY helped China in 2015 – that’s why the PBOC surprisingly weakened it in August 2015 – but it is unlikely to have the same effect now. For two reasons: 1) CNY was much more expensive back then, and 2) China was more reliant on exports. When the PBOC moved the peg in mid-August 2015 (by 2%), CNY TWI immediately weakened by about 6% and by more than 10% in the next nine months. To put it in context, CNY TWI had increased by 16% in the twelve months preceding that all-time top in July 2015 (still the all-time high). The chart below shows that CNY was almost as expensive in 2022 as in 2015, but we have already moved c. 7% below those highs.
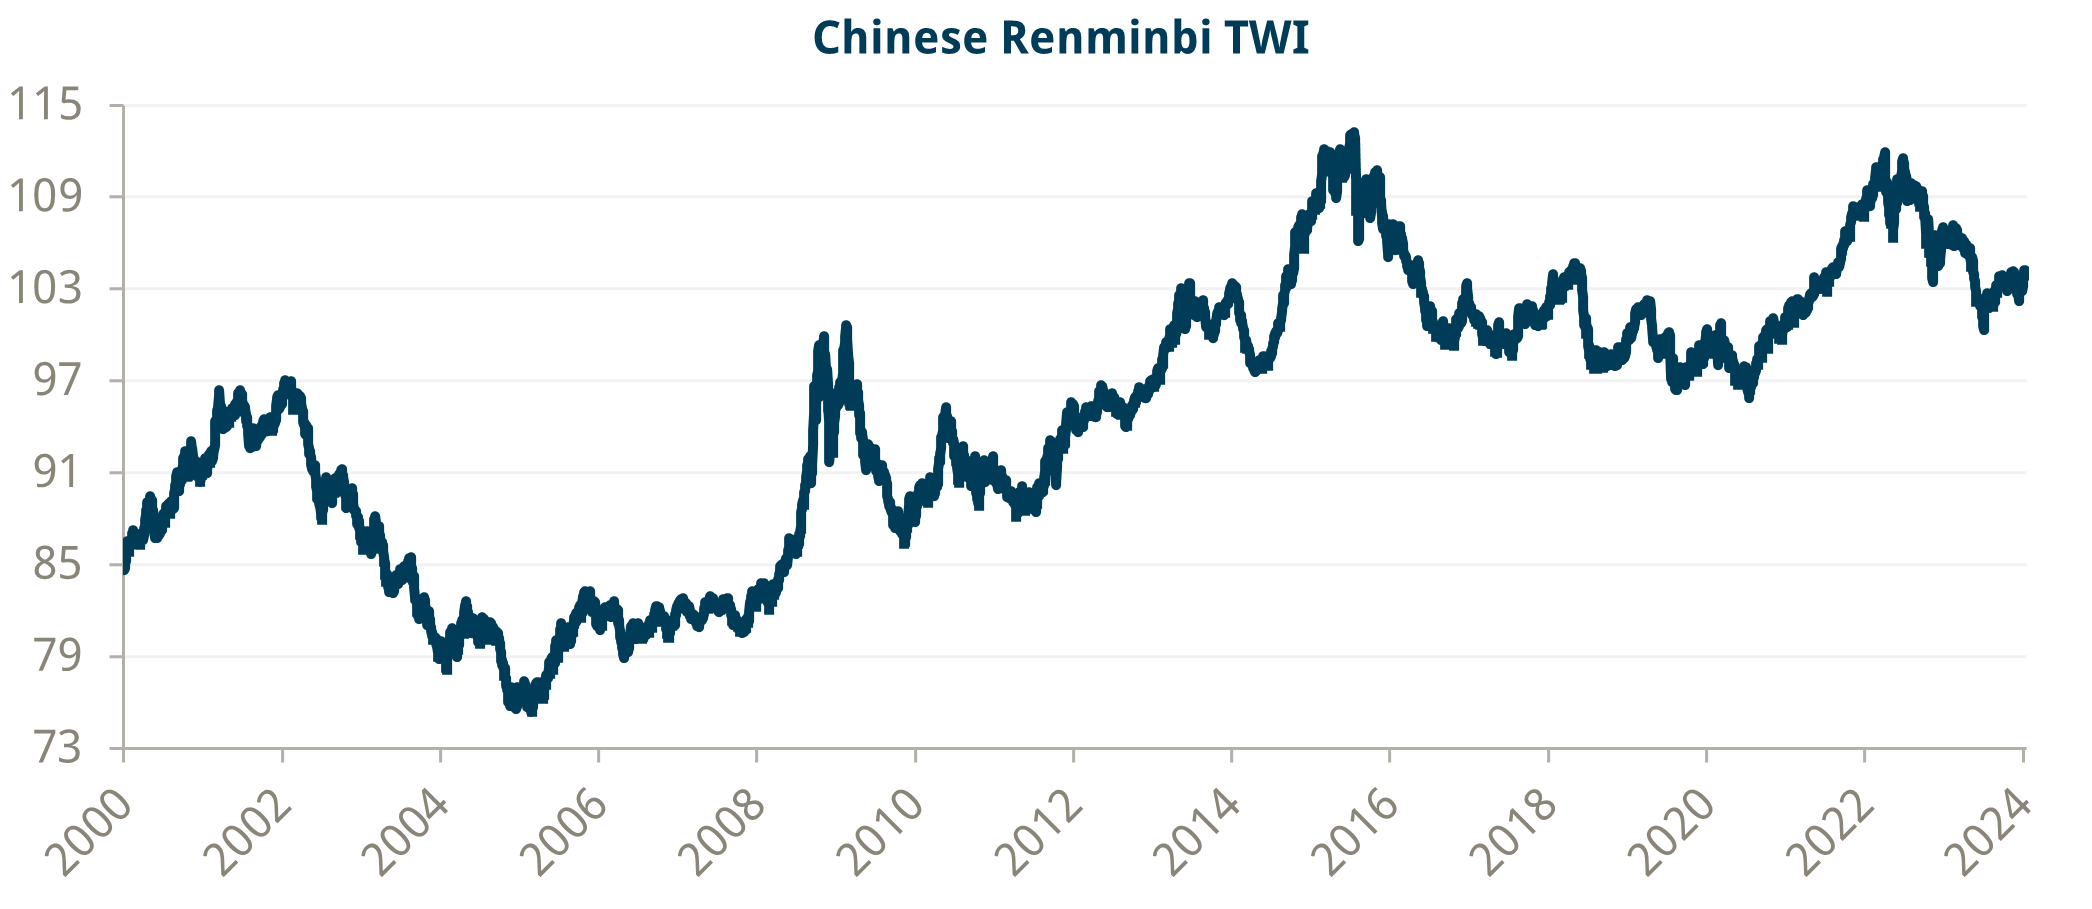
Source: Bloomberg and Trium Capital LLP
Back in 2015, weaker CNY, unfortunately, also caused quite a bit of capital outflows, which were quite substantial (see chart below). Last year, we also saw outflows, but to a much lesser degree than in 2015. The problem seems to be that a weaker Renminbi reinforces the trend of weaker domestic sentiment. The PBOC appears to have learned from the episode in 2015-16, and it has been conducting FX policy differently. Back then, the fixing was more or less in line with the previous day’s spot price, so the PBOC was in the market selling USD whenever it wanted to keep CNY from weakening too much. Last year, and still this year, the fixings have come well below spot – the state banks probably had to sell USDs to keep the market in check at certain crucial levels, but it is unlikely they did as much as the almost $1Tn sold by the PBOC in 2015-16.
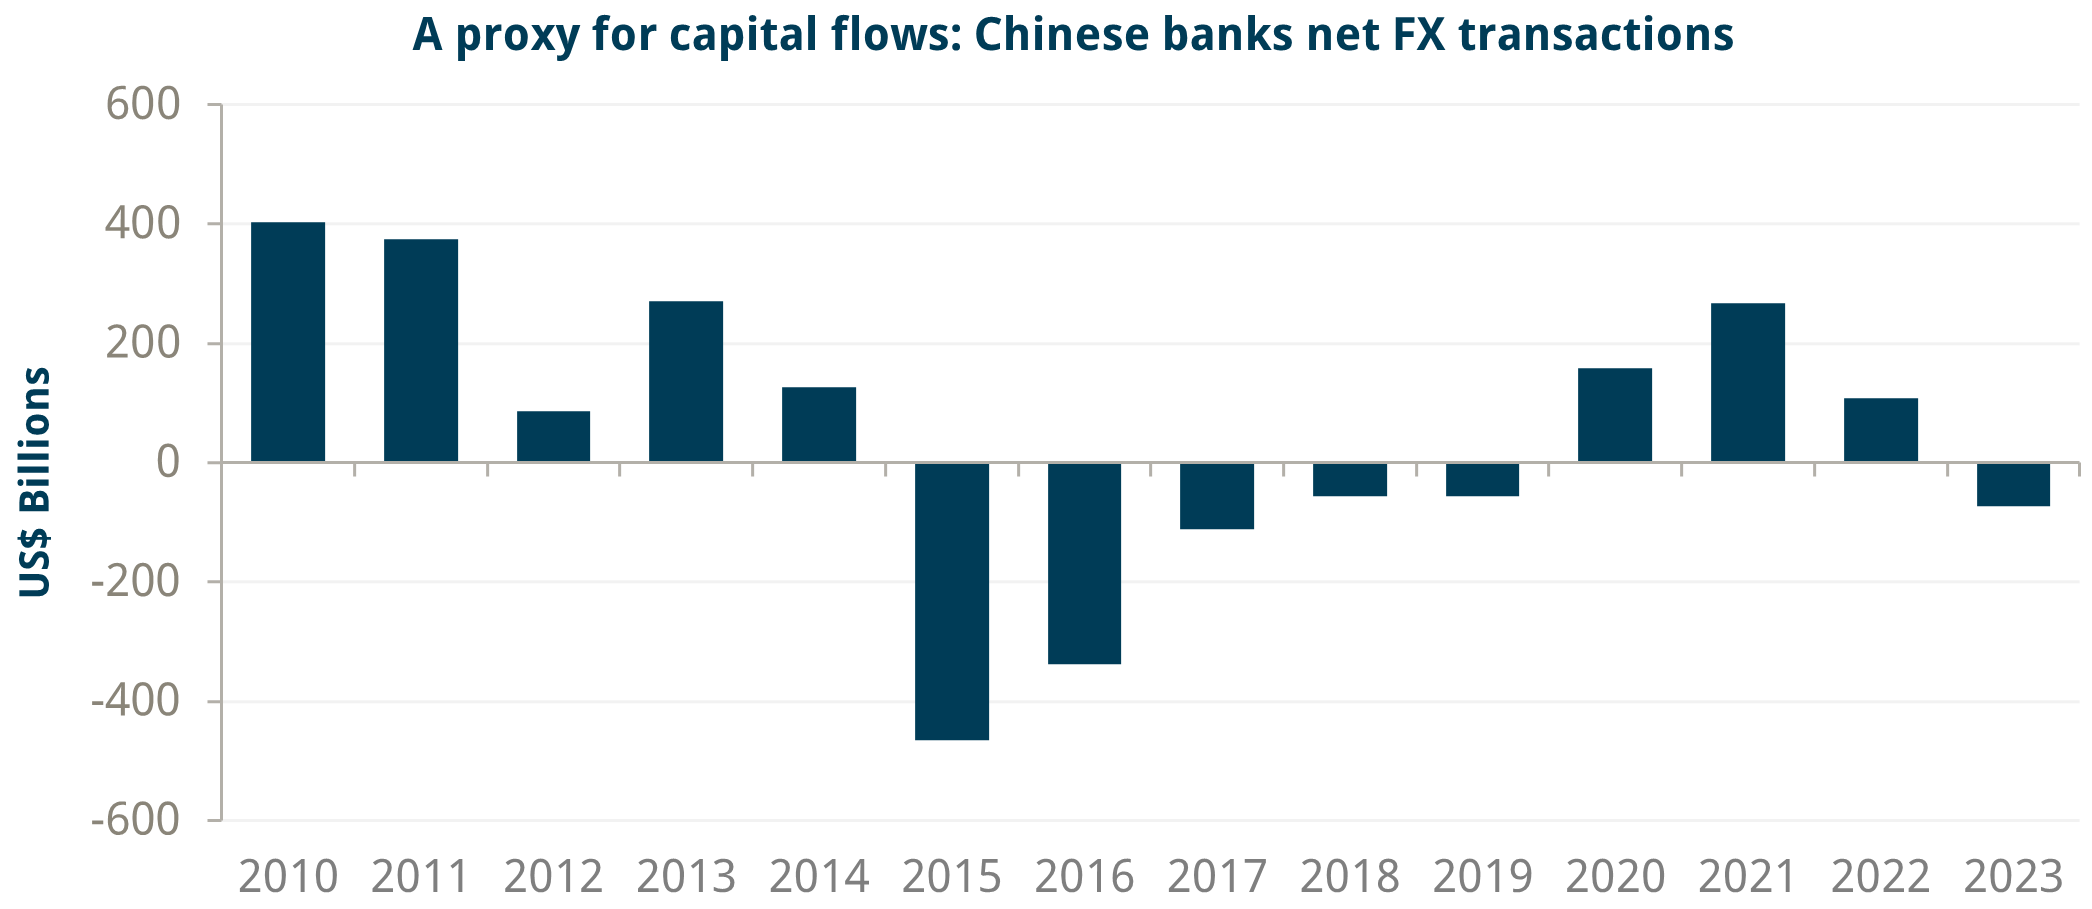
Source: SAFE
There is a myth that China continues to rely on exports for growth (and that is why CNY needs to weaken). Reality is slightly different. China’s gross exports to production ratio peaked in the mid-2000s and has been declining ever since1. That means a more significant chunk of China’s industrial production is going for internal consumption. In addition, China’s foreign value-added content of exports has also been declining since the mid-2000s (and is also below the OECD average)2. In simple terms, at least when it comes to manufacturing inputs, the US is much more reliant on China than the other way around.
The myth of exports is tightly linked to the myth that China’s domestic consumption is very weak (and needs to increase as a percentage of GDP). Again, the reality is slightly different. This Economist article3 tackles the issue head-on and points out that at least three issues are at stake here: (i) Some consumption is not measured (a large chunk of Chinese households consume through the so-called “Social Transfers in Kind”); (ii) some items are not appropriately measured (imputed rent is accounted at replacement cost, not market value); and (iii) some items are not defined properly (for instance, a large chunk of consumption by some government entities is actually classified as investment).
The bottom line is that a weaker Renminbi may help China, in theory, to reflate if it were not for its side effects (capital outflows) and China shifting its focus to higher value-added, domestic-oriented growth. Thus, we believe that a weaker Renminbi is no longer a focus for Chinese authorities.
Chinese authorities have become more assertive in putting a floor on stock prices.
Back in 2015, the authorities responded much faster to the weakness in stock prices. The Shanghai Composite peaked in mid-June 2015, and by early August, there was already, for all intents and purposes, an ‘unlimited’ credit line from the PBOC to the China Securities Finance Corporation to buy shares and support the stock market4. And by then, according to some estimates, the authorities had bought $144Bn in stock5. There were various other macroprudential measures similar to today, which were also introduced in the meantime6. Yet, despite all these, it took six months, from that first intervention in August 2015, for the stock market to bottom!
So, can we expect a similar timeline at present? We think it is unlikely. Even though, in theory, the direct rescue package available to the ‘national team’ is much smaller today than in 2015 (the macroprudential tools are very similar), at least three factors suggest the recovery can take much less time.
First, the fact that the authorities did not allow the Renminbi to weaken as much as in 2015 helped, on margin, with the sentiment – we had fewer capital outflows. Also note that even though there is only CNY 2Tn in rescue money available, it has been structured to pass from offshore to onshore through Hong Kong Stock Connect, which is not a coincidence. The authorities clearly want to make a statement – they expect the Renminbi to strengthen as a result. (We are not sure how much of that CNY 2Tn will be executed; we believe only a small portion would go through, but the intent is what matters).
Second, we have had quite a bit of forced selling this time, but the net margin exposure of Chinese investors is much smaller today than in 2015. Notice that in 2015, the stock market bottomed and ultimately stabilised only when the deleveraging stopped in early 2016. The current level of net margin exposure is very close to the lowest since July 2020.
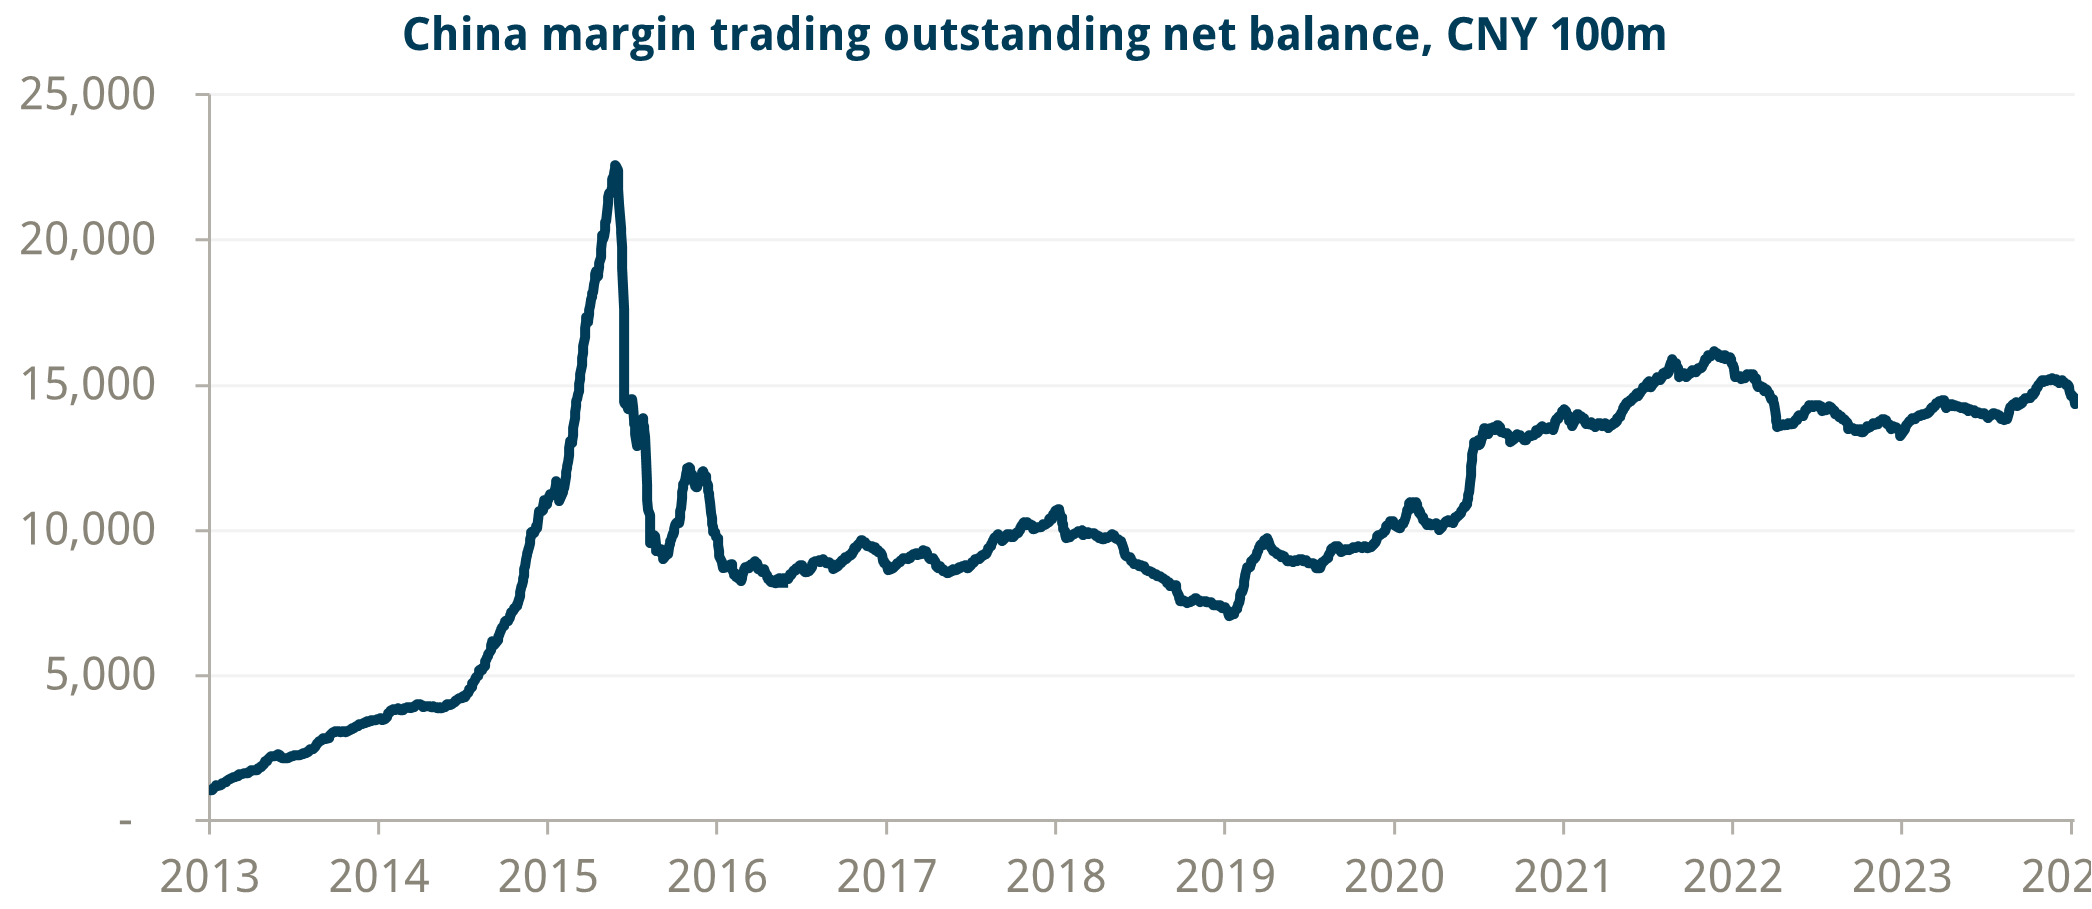
Source: Bloomberg and Trium Capital LLP
And third, Chinese equities are much cheaper today – actually, they seem to be really cheap. Take these three examples:
1) At its peak in the summer of 2015, the Shanghai Composite was trading at double the P/E ratio vs today.
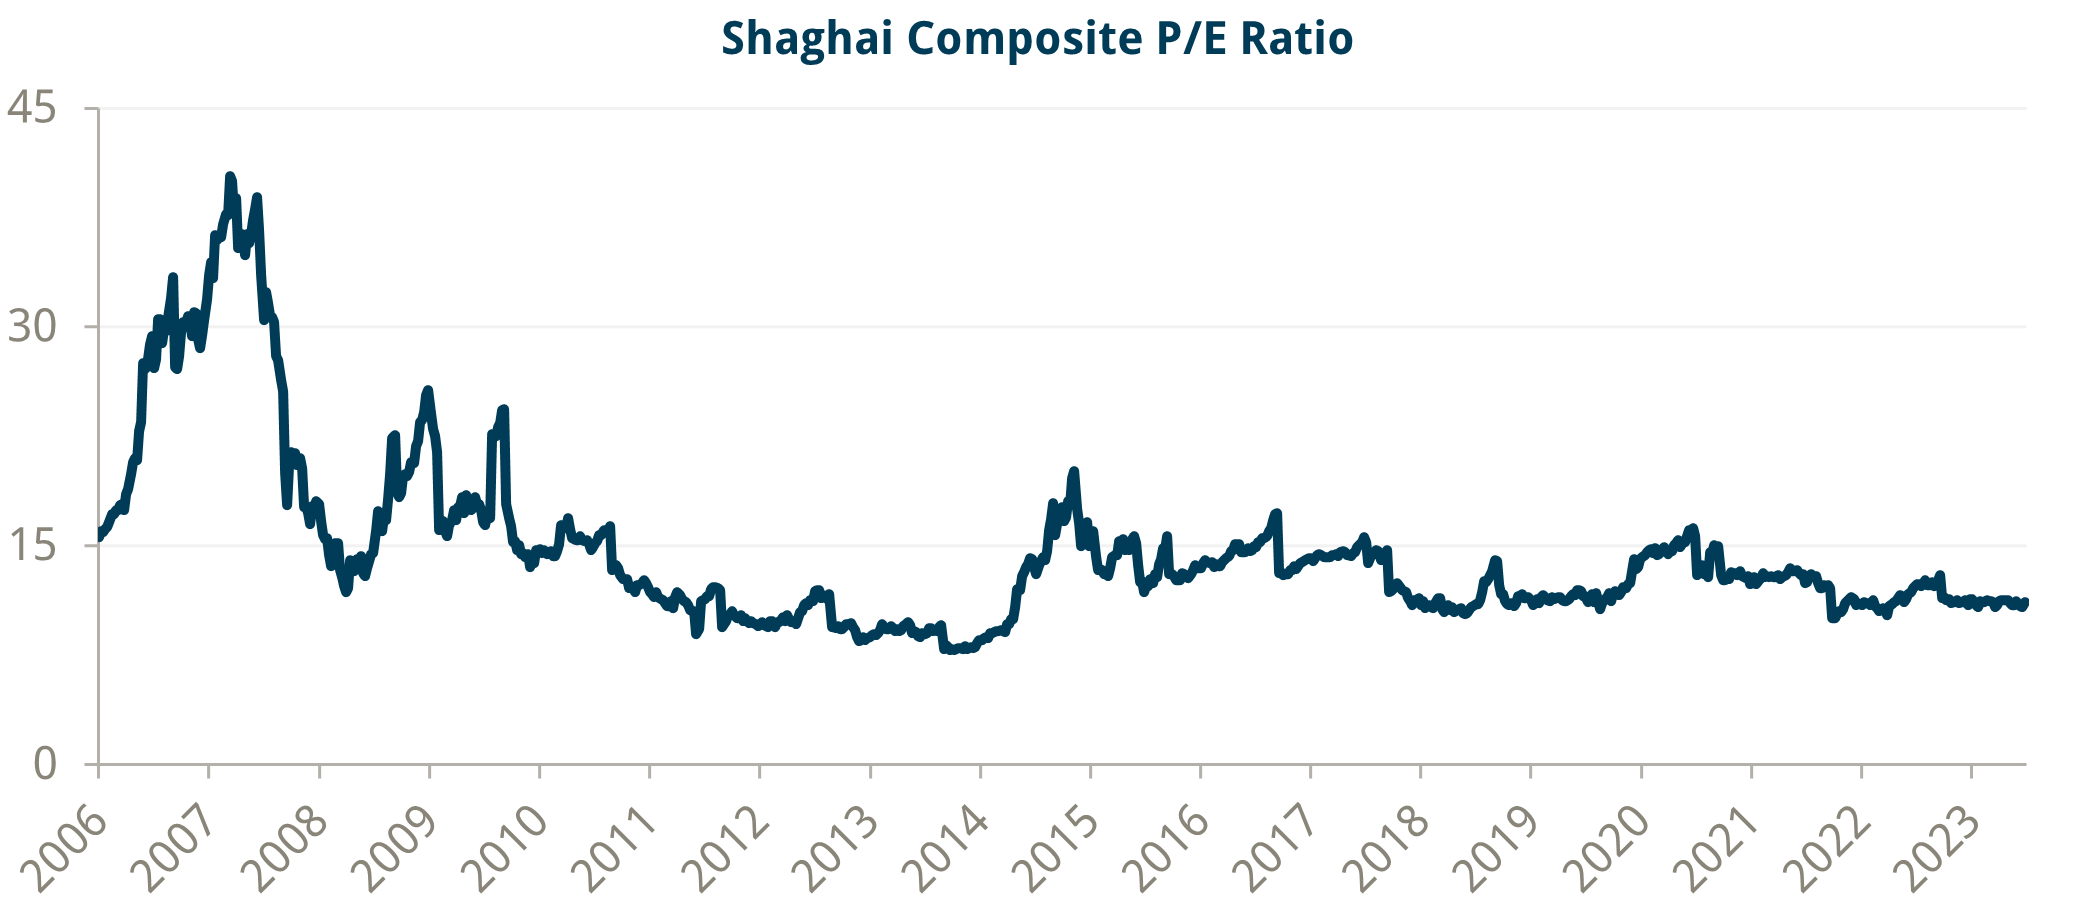
Source: Bloomberg and Trium Capital LLP
2) The dividend yield at the peak in 2015 was 200bps below China’s 10r government bond yield (CGB 10yr) – it is almost 100bps above now – and is also approaching an all-time high.
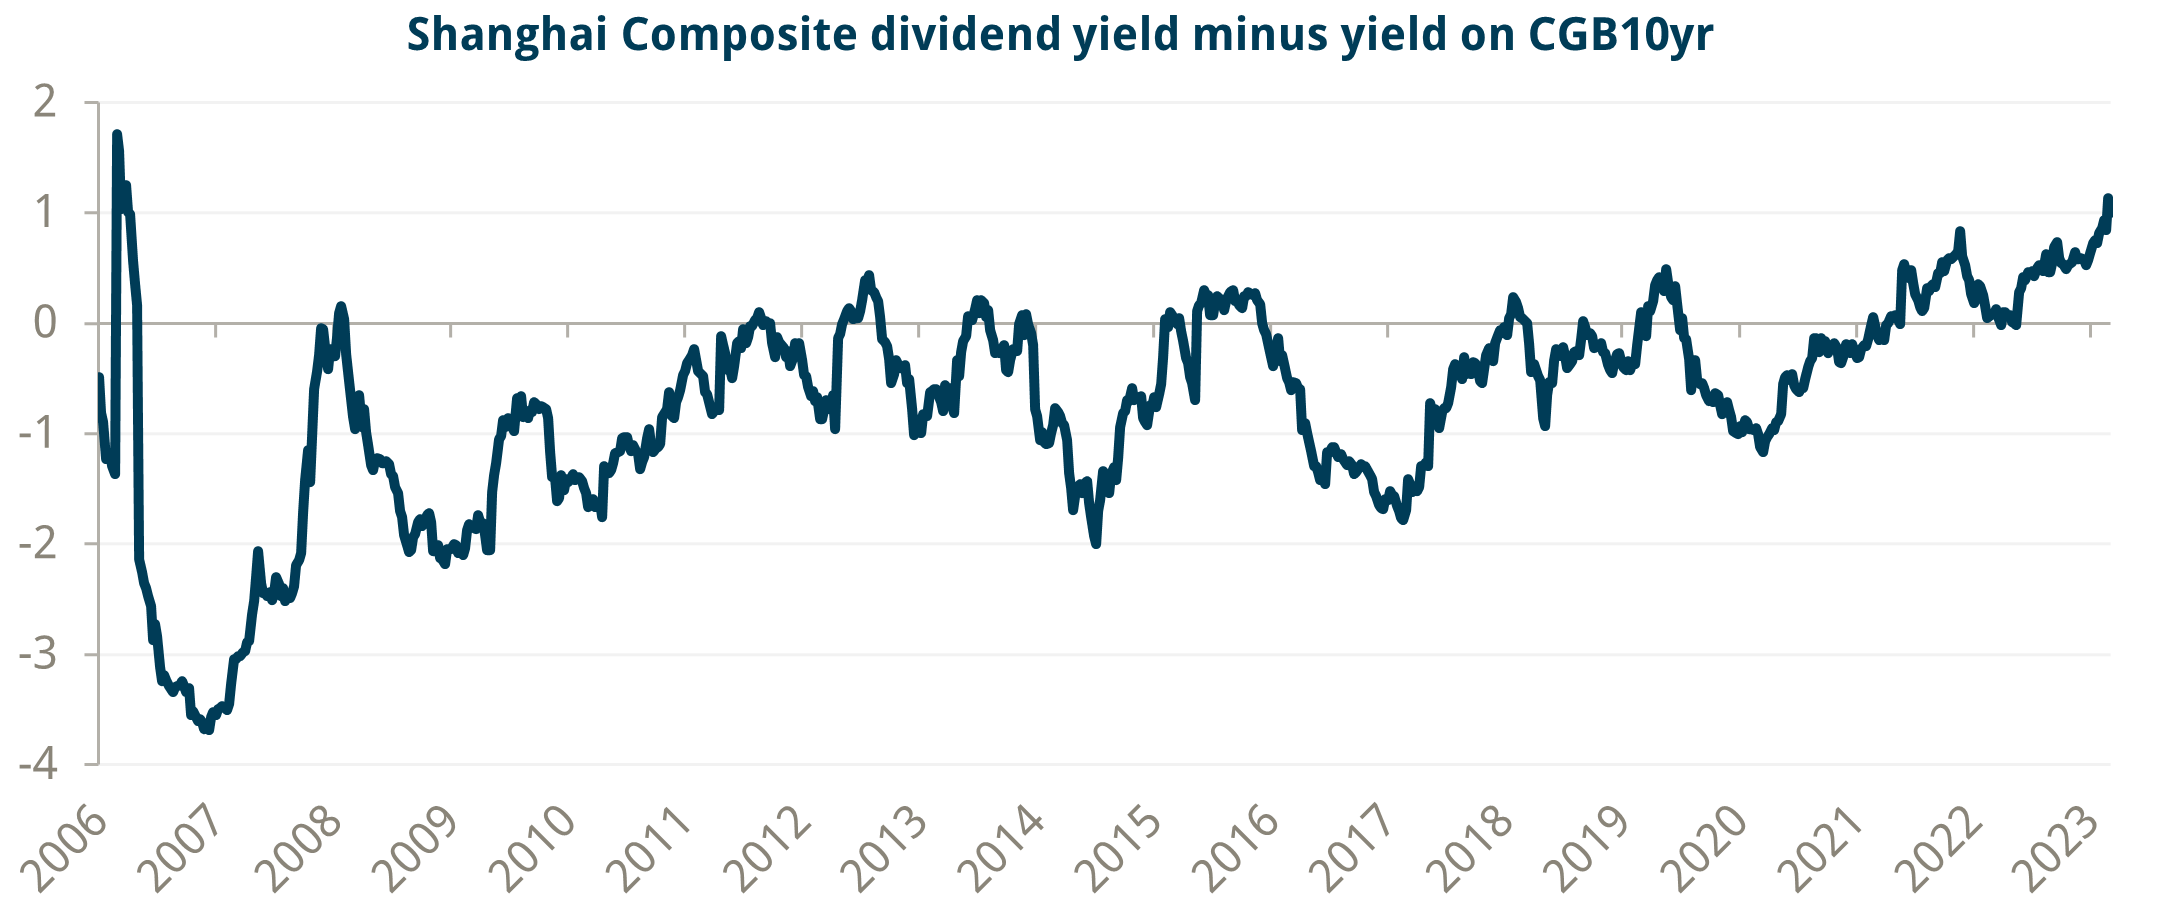
Source: Bloomberg and Trium Capital LLP
3) In June 2015, the earning yield was flat to CGB 10yr yield (and at an all-time low) vs 5.5% now (close to the all-time high at the height of Covid and before the massive rally in 2014: from July 2014 till June 2015 the Shanghai Composite rallied more than 150%!).
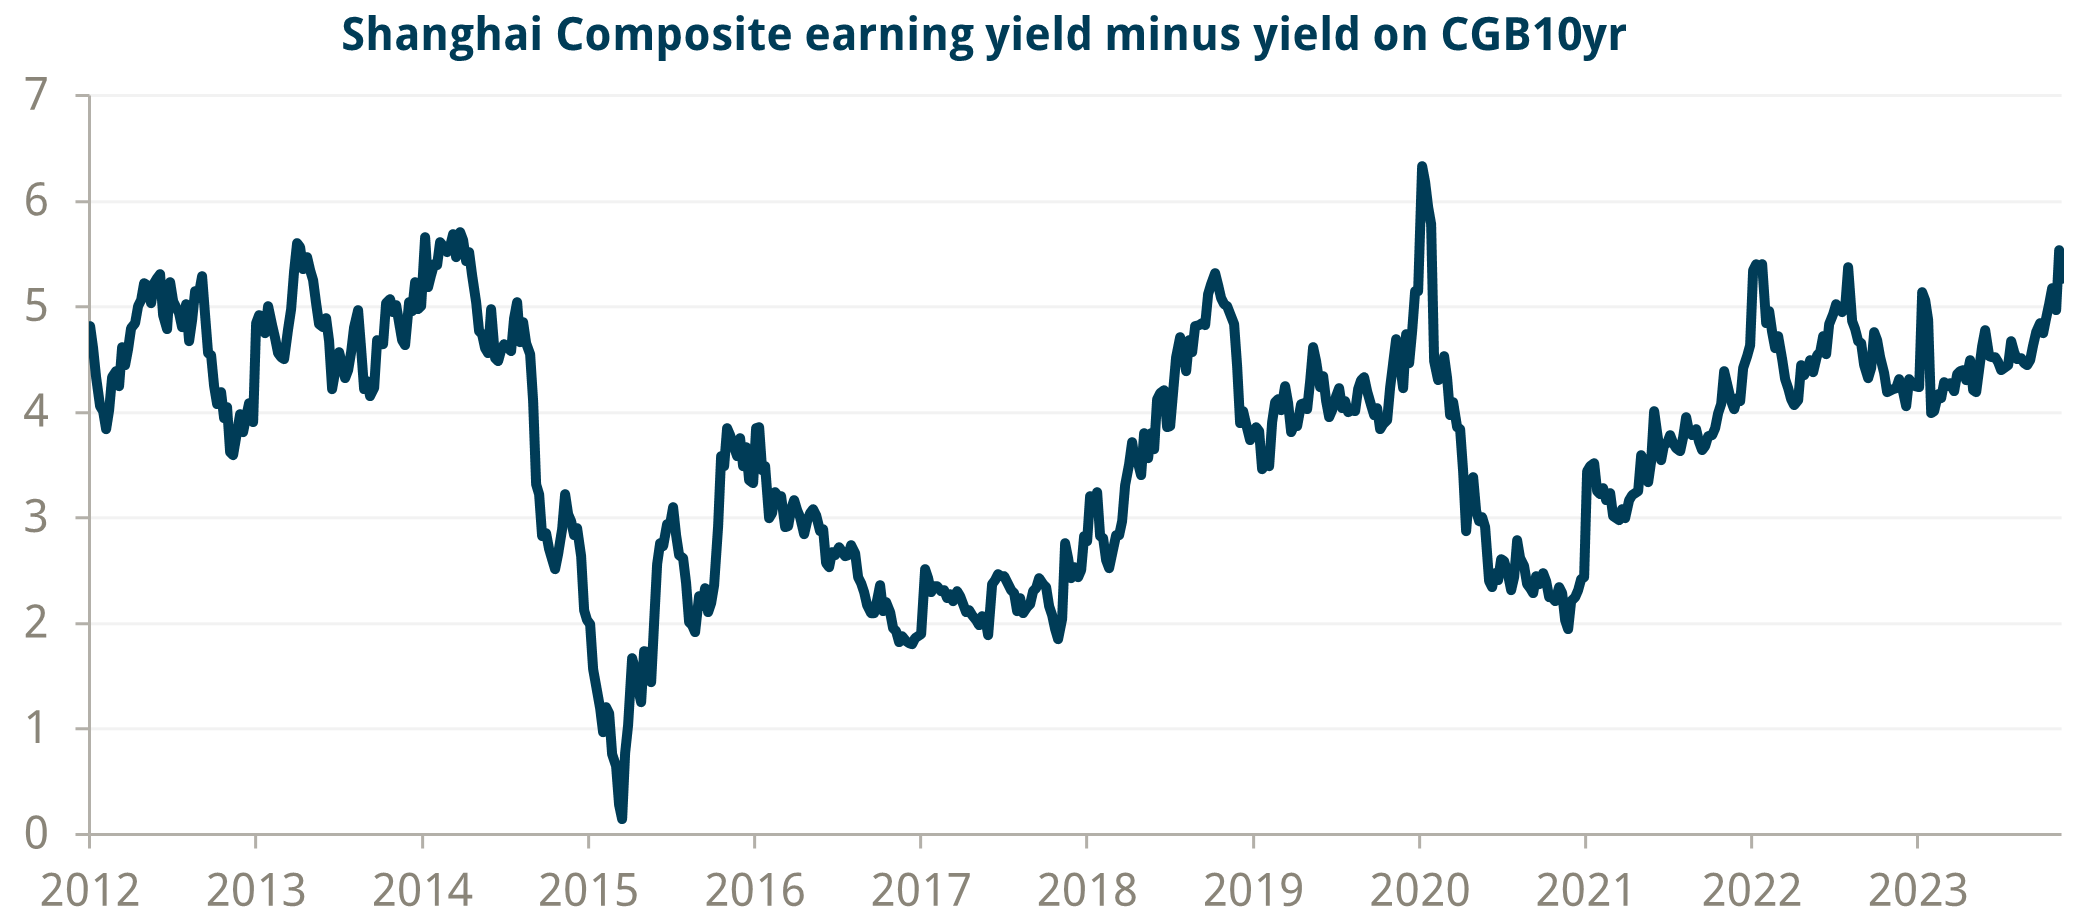
Source: Bloomberg and Trium Capital LLP
Will Chinese stocks rally from here? Anything is possible; it may take longer for Chinese households to start buying again, and foreigners will always have one foot outside the door on account of the threat of further US tariffs after the US elections (yes, tariffs matter much less since Trump’s first term in office, but they will be a sentiment dampener, nevertheless). But, at the moment, it does feel like fundamentals, technicals, and regulations are all lining up favourably for Chinese stocks.
Finally, there is the issue of what to buy. This is important, and we do not mean which individual stocks to buy, which matters a great deal, but what indices: Do investors go for A shares (listed in mainland China) or H shares (listed in Hong Kong)? Chinese authorities have said they would explicitly support A shares. It is difficult to see H shares not rallying in an environment where A shares are also rallying, but if history is any guide, H shares have tended to underperform. But then again, at these levels of underperformance, and we factor in better liquidity and the risk of sanctions weighing more on A shares, H shares may prove to have a better upside than A shares.
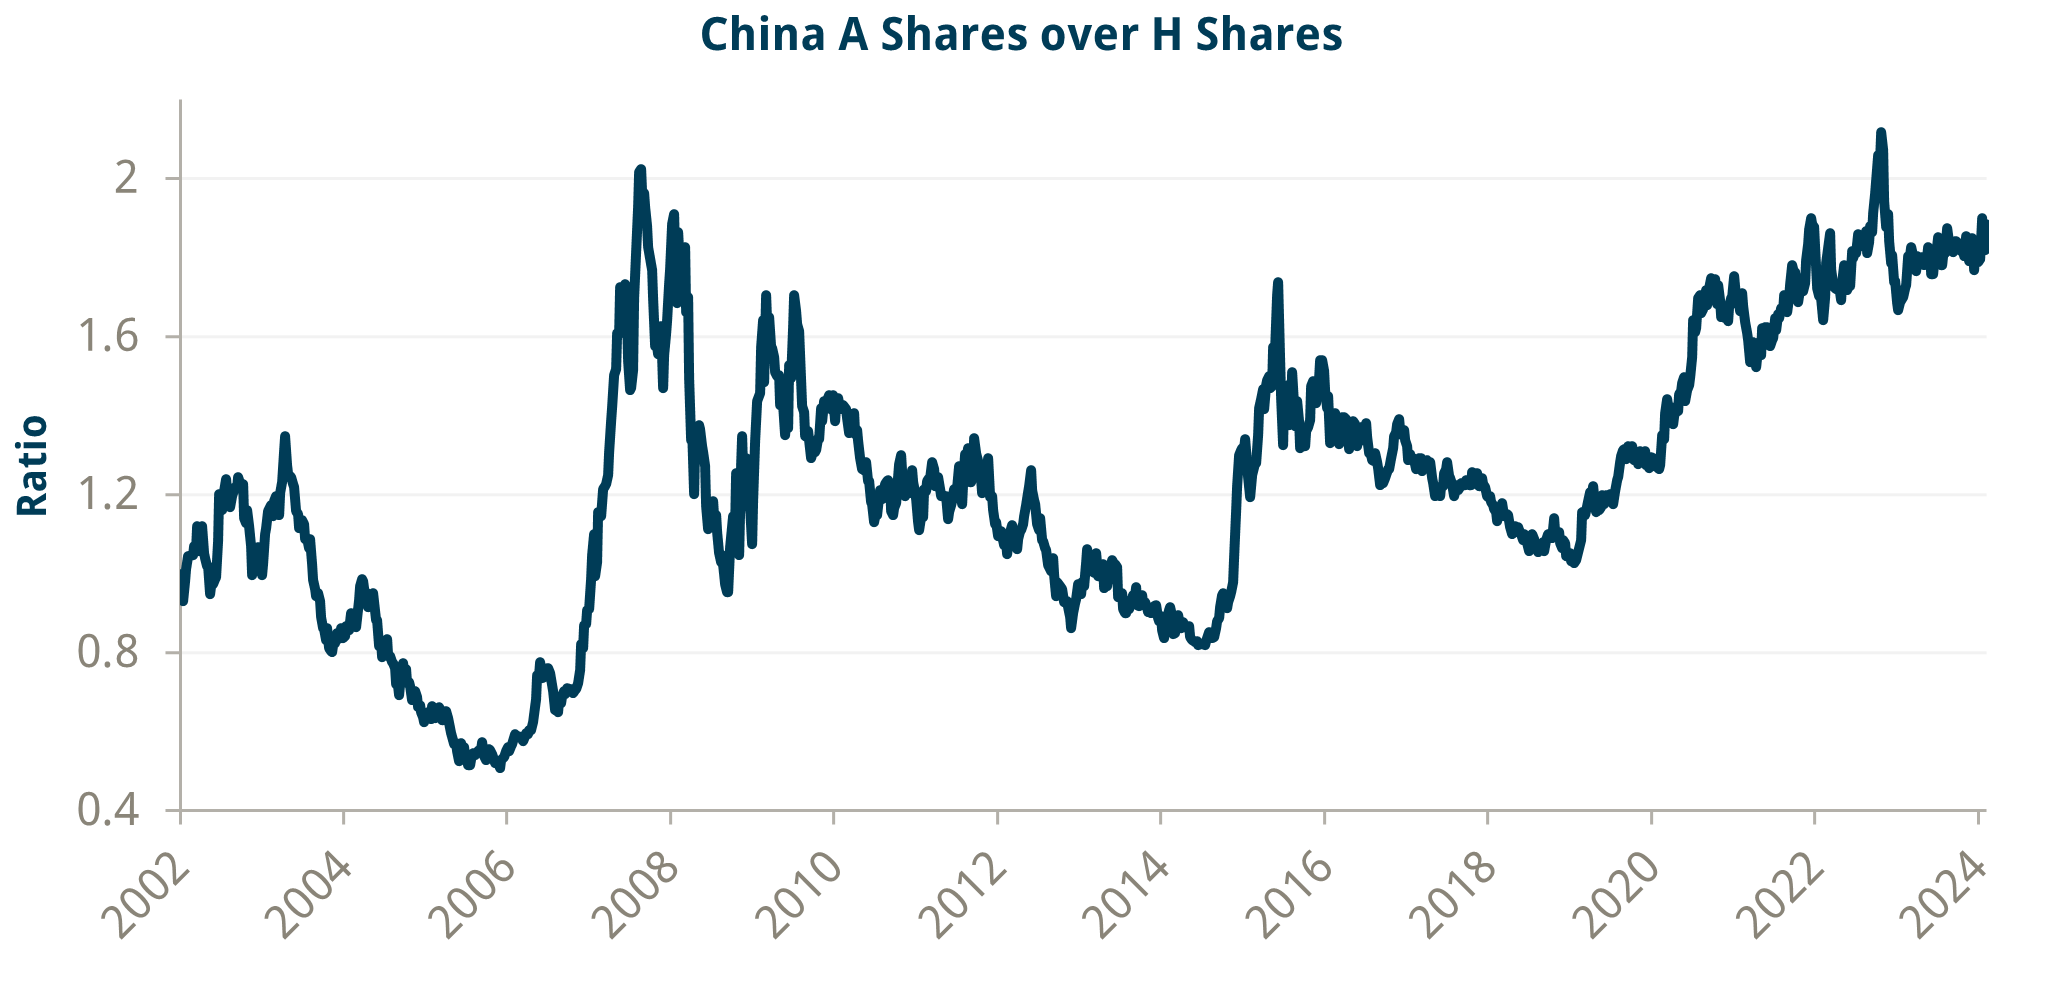
Source: Bloomberg and Trium Capital LLP
The Chinese Zodiac should not be a factor in anyone’s investment decision process, but just in case, here is what happened to the Shanghai Composite the last two times we were in the Year of the Dragon: in 2012, the stock market ended up about 3%, while in 2000 it rallied 52% (and I am sure everyone remembers what happened to US stocks – the Nasdaq closed down 37% for the year). The one thing that is not likely to change this year, whatever happens, is that China will continue to provide idiosyncratic returns to one’s portfolio.______________
- Source: OECD TiVA Database; also see “China is the world’s sole manufacturing superpower” by Richard Baldwin, January 17, 2024
- See here: https://www.oecd.org/industry/ind/CN2023_CHN.pdf
- “How economists have underestimated Chinese consumption”, The Economist, October 10, 2023
- See “Here is what China rescue fund is buying to end the stock rout”, Bloomberg, August 9, 2015
- See “Goldman estimates China’s ‘national team’ rescue at $144Bn”, Financial Times, August 6, 2015
- See here a good summary of the China stock market crash timeline: https://www.thechinastory.org/yearbooks/yearbook-2015/forum-the-well-%e4%ba%95/the-stock-market-crash/