Portfolio Manager
Share on
Trading Volatility as an asset class has a long-standing tradition in finance, most widely applied in the alternative fund space. Those who don’t trade still spend an awful lot of time watching it, as it is the primary fear/greed signal for world portfolios. And when its signals misfire, you can be certain that the sands that underpin the global financial system are shifting. And that is precisely what we are seeing at the moment.
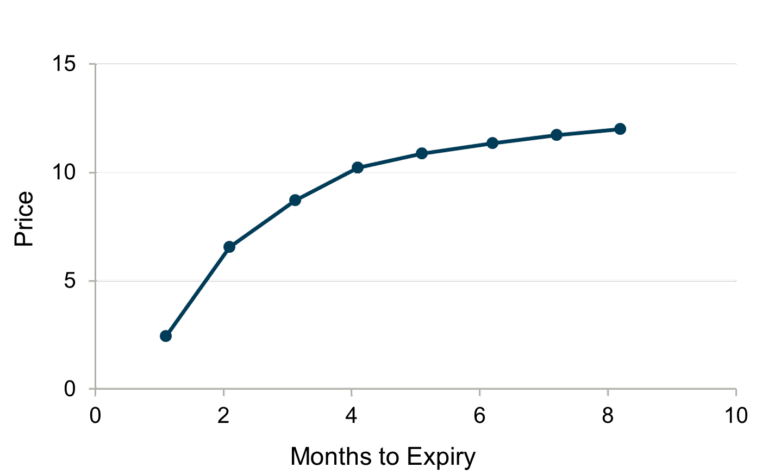
The price of volatility should be thought of as representing the cost of hedging: as the future becomes more uncertain the further you go out, the cost of hedging further out into the future should rise. This is precisely the fundamental relationship we see embedded in the VIX futures’ curve. This fundamental characteristic has led to very steep volatility curves, and where there is a slope, there is a carry trader.
Exhibit 1: Contango – VIX Curve
Investors would routinely sell VIX futures and pick up the carry as they rolled down the curve towards maturity. This has always been a magnificent carry trade: investors sell tail risk and receive a handsome premium for their troubles.
But for the lonely bears of a defensive persuasion, buying volatility as a long-term strategy is simply untenable. A long vol position, as it matures, will roll down the curve, losing value and bleeding P&L from the book. You may sleep well at night, knowing that the next day’s financial Armageddon that you carefully forecast will bring rich rewards; if it doesn’t happen on time, the woodshed awaits.
So, this upward-sloping curve (or contango) represents a fundamental axiom of finance. Hedgers have to pay an insurance premium; carry traders collect the premium. It was ever thus. Well, until now.
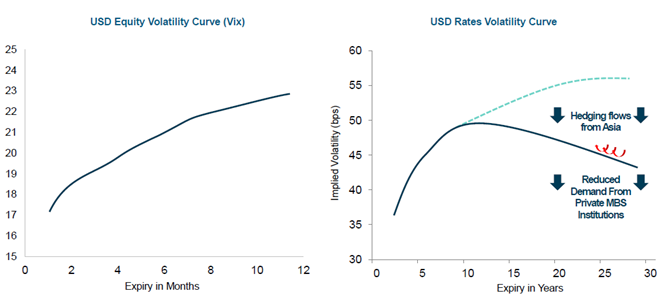
While ‘More sellers than buyers’ may be a pithy retort to explain why a price fell, it does illustrate that markets do not always price how they ‘should’ price. Traders care not for financial axioms, and flow will always dominate over reason. As such, nonsensical structural distortions can often materialise from time to time: yet these usually occur during times of stress, and are quickly priced out when calm returns. However, in the volatility markets, distortions are not only appearing but are persisting. A case in point is the US rates vol market. The two curves below illustrate the general shape of the US equity and rates volatility curves.
Exhibit 2: US Equity Volatility and Rates Volatility
For several years now, long-end rates volatility is cheaper in price than short-end volatility. It’s as if the market is saying that it has more certainty where base rates will be in 30 years than in three years’ time. This is, of course, nonsense from a fundamental perspective. But flow pays no heed to fundamentals: a hyperactive Asian structured product market (Formosa) has delivered a steady flow of long-end vol sellers, and a certain US hyperactive central bank has destroyed the natural demand for long-end volatility when it bought 60% of the MBS mortgage market post 2008. As such, ‘More sellers than buyers’ has cheapened long-end volatility to such an extent that we find ourselves in a perverted situation where you get paid to hedge your long-rates exposure. Why do you get paid? Well, a long vol position in US rates, as it matures, will roll up the curve and appreciate in price. If the fabled bond vigilantes ever hold the fiscal incontinence of the US administration to account by dumping long-end bonds, the hedge that you’ve been paid to take out should make a tidy sum.
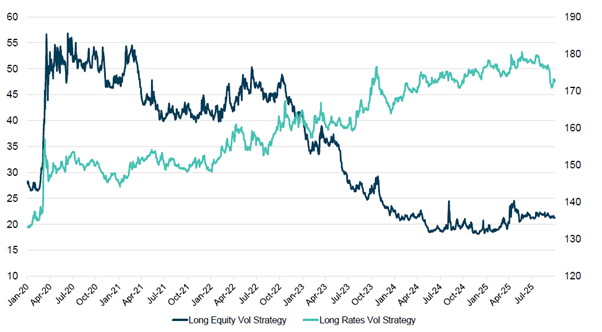
To give a sense of how much the slope of the vol surface matters when hedging any exposure, here we show two simple long vol strategies (see page 3): one buys long-term S&P volatility, and one buys long-term US rates volatility. Both strategies made a tidy return in the Covid debacle, but in the following years, the long equity vol position slowly bled out its return. The US rates vol, however, while it never quite had the punch of equity vol in the crisis (it never does), proceeded to gently trickle upwards. There is no clever macro narrative behind these differing profiles: it is simply down to the different slopes of the vol curves.
Exhibit 3: Rates Volatility vs. Equity Volatility – Strategy Returns
When the phenomenon in the US rate appeared in 2016, there was much debate as to how long the structural distortion would last. The Fed, however, has quite enjoyed suppressing long-end rates volatility as it has alleviated much of the rate rise pain for the US mortgage/housing market. I suspect they have no intention of ever taking their intervention hand off the tiller, and so the distorted curve is now a feature rather than a bug of the market. Where the story takes a quite surreal turn is that now distorted vol curves have begun popping up in equity land, in particular, the vol curves of those companies run by our favourite tech oligarchs.
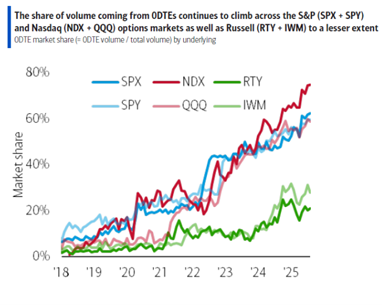
But this time, rather than a balance sheet bloated central bank weighing down the vol curve, enter stage the new protagonist – the zero-day option market.
Exhibit 4: Zero-day Option Market Volume
The zero-day options market takes the award for the largest market that barely anyone has heard about. The vast majority of all options traded on the US indices now have a term of less than 12 hours. Using the loosest possible definition of the word, ‘investors’ either sell options in the hope that there is no price move or buy in anticipation of a price move. Over the last year, the flow for the MAG7 has been an unrelenting call buying frenzy, and this push for ever-shorter dated call options has sent short-dated option pricing (i.e. short-term volatility) higher. And at the more ‘sensible’ end of the speculator spectrum, we also see the explosive rise of the single-stock income maximiser ETFs. These investors buy the chosen MAG7 stock of their choice and sell 3-to-9-month call options against their position to generate a significant yield while giving up some of the upside in the stock. As these ETFs have grown truly gargantuan, there is now a steady tidal flow of call selling (equivalent to volatility selling) at the back of the curve.
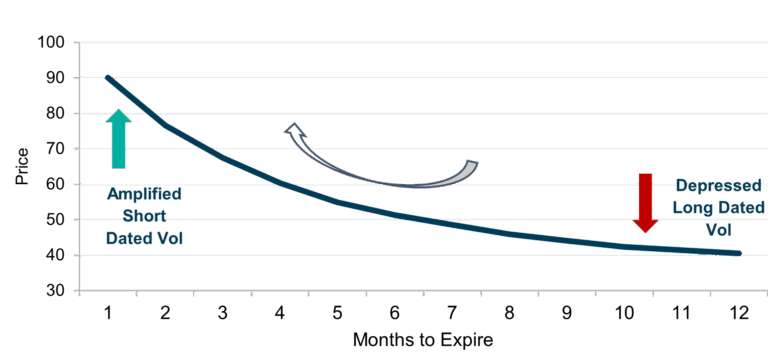
Exhibit 5: Risk On – Volatility Curve
And just like the US rates vol curve, we now see a backwardated surface across most MAG7 stocks that has nothing to do with the investment outlook (short- or long-term), but everything to do with distorted flow dynamics. Too many people are buying short-dated volatility, and too many people are selling long-dated volatility.
For a defensive fund, looking for ways to drift higher in a raging bull market, whilst maintaining a strong negative beta to the stock market, these backwardated vol surfaces are manna from heaven. Irrespective of one’s views on the now-standard practice of vendor financing and round-tripping of revenues for the tech sector, the painful reality for any long-only investor is that one must own the US tech sector. Timing an underweight position, or for the brave of heart, a short position has ended the careers of many (read most) fundamental investors. There are no bears left standing.
Yet now it is possible to buy a long volatility position in your favourite tech behemoth and get paid for the privilege of your contrarian view. No need to time the market, no bleed, no lingering corrosive self-doubt. Just sit back, put your slippers on and buy tech vol. Time to really enjoy the bubble.
To access Trium Capital strategies, please select your investor type and territory from the below options:
Please indicate by clicking the box below, that you have read and agree to the following important information:
The content on www.trium-capital.com (the “Site”) is general information which is provided without any warranties of any kind, whether express or implied by any means whatsoever. While we have sought to ensure that the content contained on this Site is timely and accurate, we make no representation, warranty or statement of any kind with respect to the Site and the timeliness, accuracy or correctness of the content provided herein. We may change the content at any time without notice and, to the fullest extent permitted by law, will not be liable for errors or omissions in the content.
Any entry into a contract with any party mentioned on this Site or in respect of any product referred to on this Site shall be subject to the terms of that contract, and the information contained on this Site shall not constitute a representation, warranty or statement in respect of such contract to the fullest extent permitted by law.
By using this Site, you acknowledge that the Site contains copyrighted materials as well as trademarks and service marks that are owned by Trium Capital LLP, or its affiliates (“Trium”) or third parties. Nothing contained in this Site shall be construed as conferring any right to any copyright, trademark or other proprietary interest of Trium or any third party. You agree not to infringe upon any copyright, trademark, service mark or patent right, and to comply with all law and regulation in respect of any permitted use or viewing thereof. You also agree that you will not alter or remove any copyright, trademark or any other notice from any authorised copy of the content on this Site.
Certain links in this Site connect to websites maintained by third parties. We make no representations or warranties as to any content contained in these third party sites and take no responsibility for such sites. Our link to another site is not an endorsement of that site.
We are not responsible for providing you with, on behalf of anyone other than ourselves, information required under Article 13 or 14 of Regulation (EU) 2016/679 of the European Parliament and of the Council of 27 April 2016, on the protection of natural persons with regard to the processing of personal data and on the free movement of such data, and repealing Directive 95/46/EC (General Data Protection Regulation). We may provide you with access to other websites which contain information pursuant to such regulatory obligations on behalf of third parties, but we make no representation, warranty or statement as to the completeness, accuracy or truthfulness of such information.
In no event will Trium be liable for any damages, expenses or losses, including without limitation direct, indirect, consequential, special, incidental or punitive damages resulting from or caused by the use of this Site or the information herein (or any information on a linked website), the inability to use this Site or the information herein, any delay in operation or transmission or any communication line or system failure.
Your access to and use of this Site are subject to the terms and conditions contained herein. By accessing and using this Site, you accept these terms and conditions, without limitation or qualification. These terms and conditions may be supplemented, amended and/or rectified at any time by Trium.
This Site is operated and issued by Trium Capital LLP which is authorised and regulated by the Financial Conduct Authority (Register number 497640). You can gain access to the FCA’s rules and guidance notes from the following link: www.fca.org.uk.
Please visit the main website of Trium Capital LLP, www.trium-capital.com for full regulatory disclosures.
This website is issued by Trium Capital LLP, a limited liability partnership incorporated in England & Wales (Partnership number OC343790) which is authorised and regulated by the UK Financial Conduct Authority (FCA) (497640).
The information presented herein expresses the personal views of authors in the current economic environment and not necessarily those of Trium Capital LLP (“Trium”). This information is intended for informational purposes only and does not qualify as investment advice nor does it constitute an offer to sell or the solicitation of an offer to buy any securities or interest in any fund managed or operated by Trium or its affiliates.
Any articles on this site may contain forward-looking statements relating to the objectives, opportunities, and the future performance of the U.S. market generally. Forward-looking statements may be identified by the use of such words as; “believe,” “expect,” “anticipate,” “should,” “planned,” “estimated,” “potential” and other similar terms. Examples of forward-looking statements include, but are not limited to, estimates with respect to financial condition, results of operations, and success or lack of success of any particular investment strategy. All are subject to various factors, including, but not limited to general and local economic conditions, changing levels of competition within certain industries and markets, changes in interest rates, changes in legislation or regulation, and other economic, competitive, governmental, regulatory and technological factors affecting a portfolio’s operations that could cause actual results to differ materially from projected results. Such statements are forward-looking in nature and involve a number of known and unknown risks, uncertainties and other factors, and accordingly, actual results may differ materially from those reflected or contemplated in such forward-looking statements. The reader is cautioned not to place undue reliance on any forward-looking statements or examples. Neither the author nor Trium or any of its affiliates or principals nor any other individual or entity assumes any obligation to update any forward-looking statements as a result of new information, subsequent events or any other circumstances. All statements made herein are only as of the date that they were made.