Customer water bills in the UK are projected to grow by almost 26% from 2025 to 2026. This growth is front-loaded and will slow by 2030 but is among the fastest globally over the next five years6. Bills are lower in continental Europe, averaging around €400–450 in France, €320–360 in Italy, and €300–350 in Germany7, reflecting state provision and cost-recovery models that constrain growth. US bills average $500–600 a year8, ranging from $300 in the Midwest to over $1,000 in California. European and US bills remain well below 1% of household income, leaving greater regulatory headroom for increased investment. Though bills in emerging markets are lower in absolute terms, they are higher relative to income, creating political risk. Emerging markets show more volatility, for example, Philippine households pay ₱500–1,000 per month9 (~£80–160/year).
One of the more complicated issues to analyse in water companies is their allowed return on equity. For most jurisdictions, there is a standard regulatory return alongside a series of indicators that either enable higher returns or may lead to penalties. In the UK, Ofwat set an allowed Return on Regulated Equity (RORE) of 5.1%10, but Asset Management Period 7 (AMP7) figures showed companies achieving up to 8.6% RORE11 through performance incentives and operational efficiency gains. The Cunliffe Review has recommended narrowing the scope of such incentives, potentially limiting upside returns in future periods.
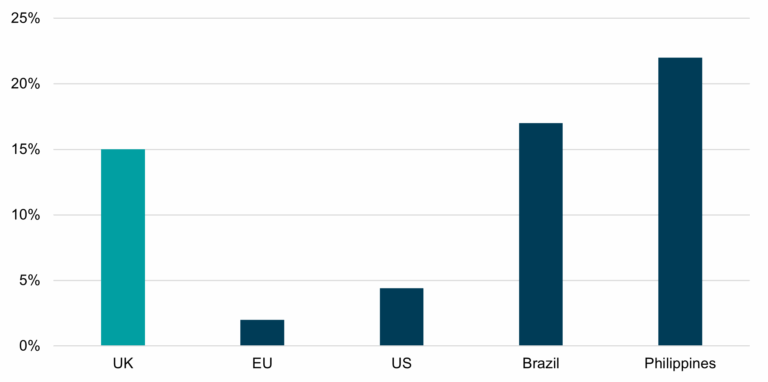
The base-allowed returns in the UK are lower than in most other countries with listed water equities. For example, Italy’s RORE under ARERA’s MTI-4 framework is set at 6.13%. In the US, authorised ROE based on recent rate cases appears to be more favourable, with top performers typically ranging from 9.5-10%12. Emerging markets generally permit higher returns to reflect greater risk, with RORE’s in the 10–12% range13 in Brazil, while the Philippines runs fixed nominal 12% ADR14.
Compared to other regulated water systems, the UK regulator is in a more challenging spot with rising bills and greater investment required. We would suggest that one pathway out of this dilemma is to increase focus on efficiency, incentive-based return structures, and possible consolidation of less efficient operators. This should favour the listed UK water sector, which has generally been able to execute better than private operators despite the media and political headlines.
We believe that listed water utilities are an attractive sector globally, given the growth profile discussed above. We believe that other regions will eventually need to match the UK’s aggressive investment increases and be able to fund this through customer bills. The UK water sector has more volatility in outcomes than other geographies, but we believe future regulation will reward efficiency and scale, which should ultimately benefit the listed sector.