The Mechanical Market

Harjinder Thandi

Portfolio Manager

Harjinder Thandi

Portfolio Manager
Harj Thandi has over 20 years of investment experience specialising in index rebalance and event-driven equity strategies. Harj is the Portfolio Manager of the Trium ArKa Strategy. He was previously a Senior Portfolio Manager at Millennium Capital Partners across two tenures, where he managed a dedicated index rebalance equity strategy, and earlier at Schneider Investment Associates. Prior to the buy-side, Harj was European Head of Portfolio Trading and the Centralised Risk Book at Citigroup. Before that, at Bank of America Merrill Lynch, he ran the pan-European developed-market index arbitrage books and headed the North American Centralised Risk desk, developing index rebalance strategies across both regions.

Share on

In 2024, for the first time in history, more money globally followed a rule than followed a manager, with passive fund AUM surpassing active across all asset classes. The trend has no sign of reversing.

In the US alone, since 2016, passive funds have attracted $6.4 trillion in net new money while active funds have suffered $2.4 trillion in outflows – a combined swing of nearly $9 trillion. Every dollar that moves from active to passive becomes a dollar that reallocates at reconstitution, not on a manager’s signal. With $40-50 trillion benchmarked globally, rebalancing events are now among the largest single-day capital movements in history.

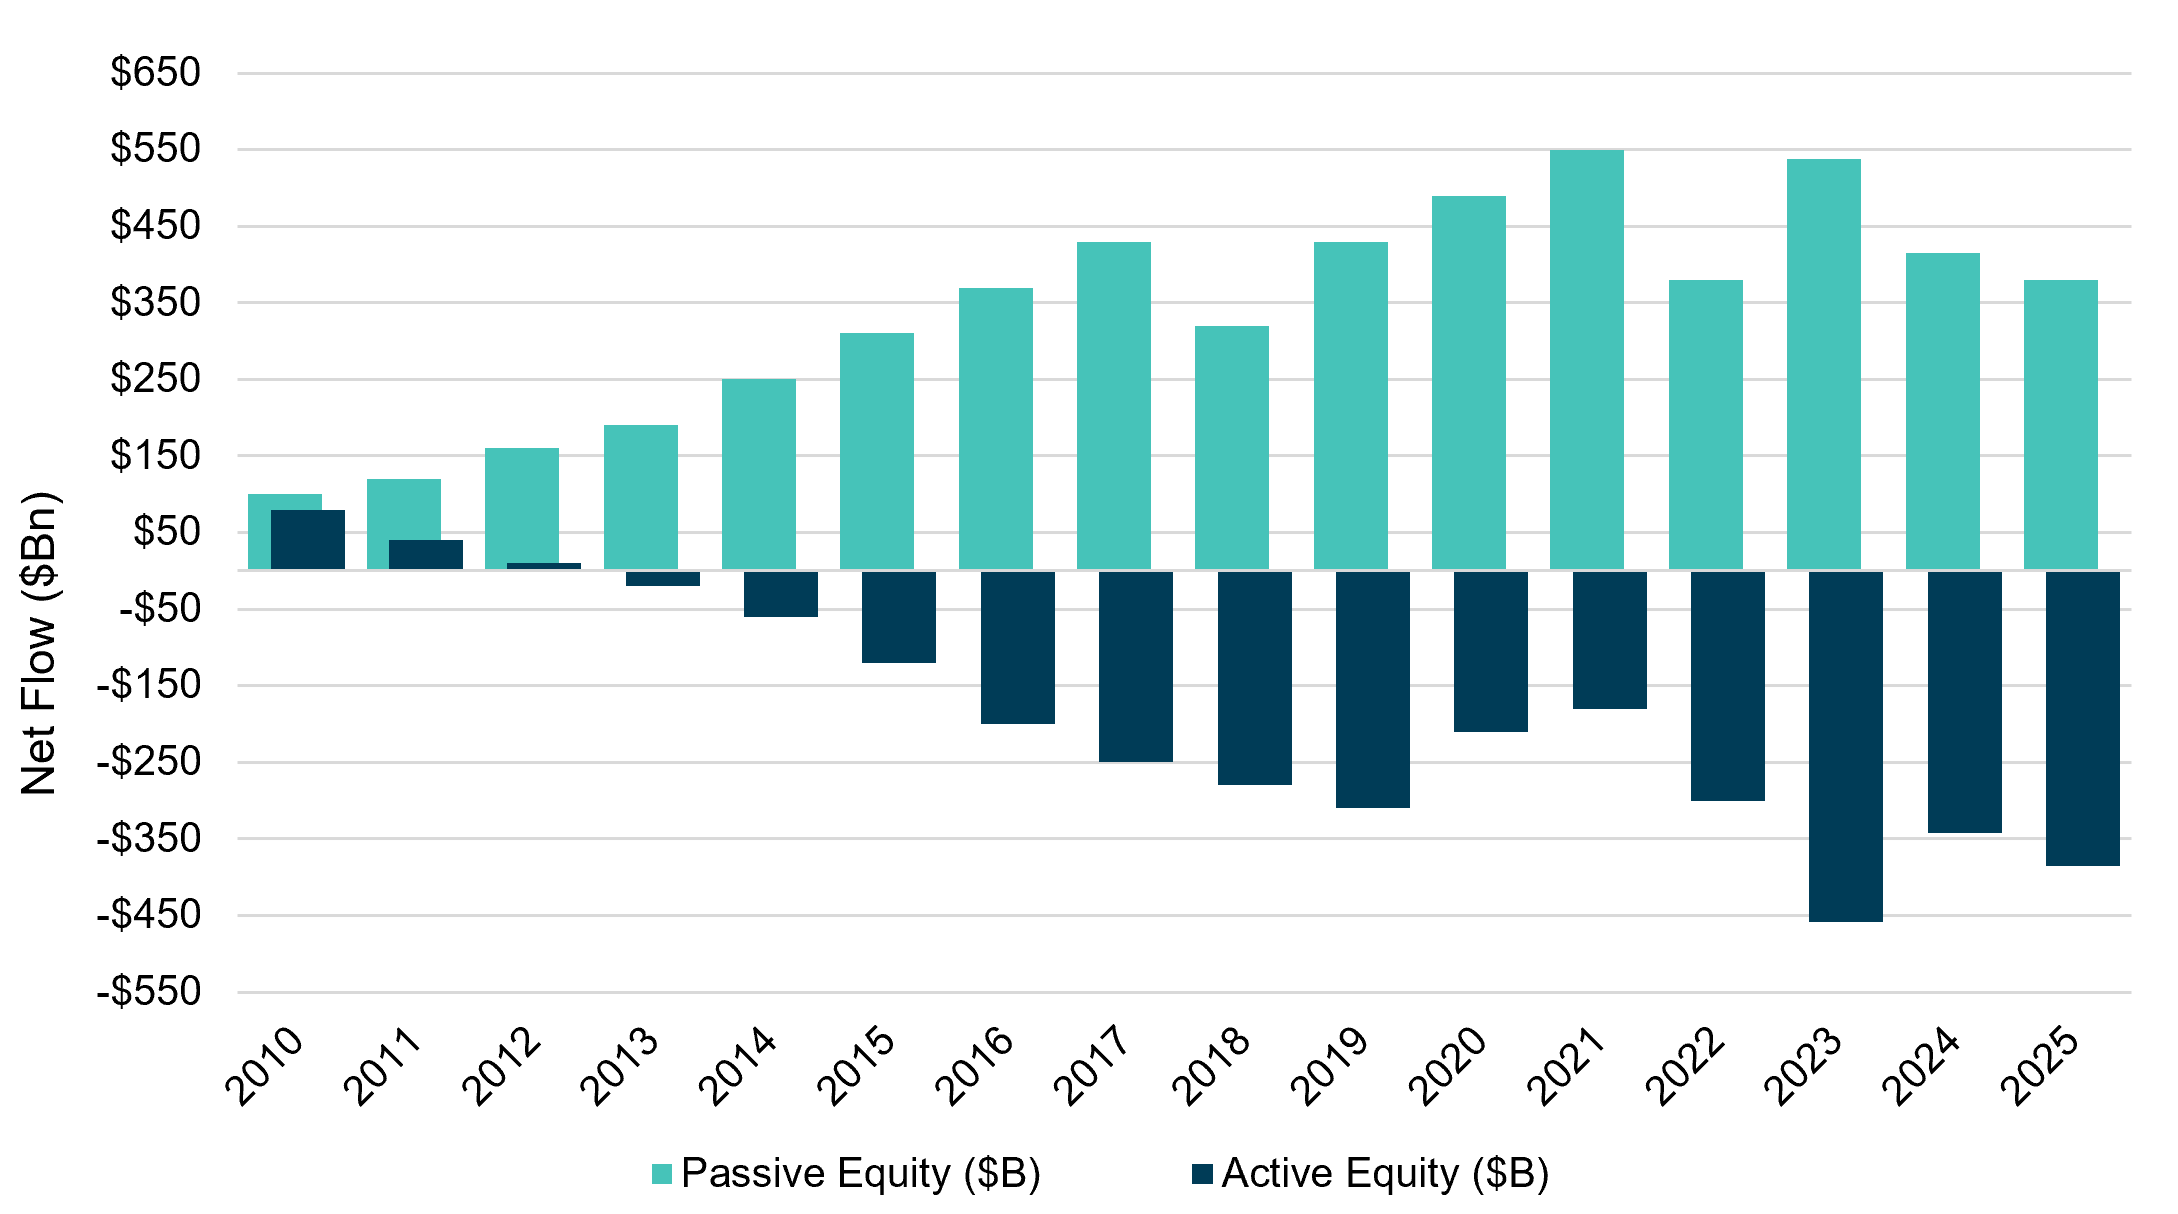
Passive equity, for instance, has attracted net inflows in every calendar year since 2010, through drawdowns and rate shocks alike; active equity has been in net outflow since 2013, shedding a reported $386 billion in the US in 2025 alone.

Exhibit 1: Annual Passive Equity vs Active Equity Net Flows (2010-2025)

Source: ICI; Morningstar Direct Asset Flows; Morningstar US Fund Flows Jan 2026. 2025 data: passive large-cap +$380B; active equity -$386B. US-domiciled funds.

The Mechanical Dollar & Reconstitution Days

The passive vs active headline is familiar. The consequence is less discussed, and it is the part that matters to me. Every dollar that moves from active to passive becomes a dollar that reallocates on a rule, not on a view. An active manager decides what to own and when. A passive fund owns what the index says it must, in the weight the index dictates, and rebalances when the index tells it to. The $9 trillion swing has not merely changed who manages the money, it has changed the mechanism by which the money moves. This pool of benchmarked assets now exceeds $40–50 trillion across the three largest index providers alone, of which global ETF assets alone have reached nearly $20 trillion.

The most visible expression of that mechanism is index reconstitution: the periodic day on which providers add, drop and reweight constituents, and every passive asset tracking the index must trade to match. What was once a bookkeeping formality has become one of the largest coordinated capital movements in markets.

The numbers are stark. At the June 2024 Russell Reconstitution, a record $219.6 billion was traded across US exchanges in a single day. The Nasdaq Closing Cross executed $95.3 billion of that in 0.878 seconds. Approximately $10.5 trillion in assets are benchmarked to the Russell US Indexes (with $19 trillion benchmarked to FTSE Russell global indexes); roughly $2 trillion tracks them passively – and all of it must rebalance simultaneously. The 2025 reconstitution surpassed this again: the Nasdaq Closing Cross recorded a record notional value of $102.45 billion – a 7.5% increase on 2024.

Over the past two decades, the dollar volume of the Russell Reconstitution has grown by 950%. The trade volume has grown by 450%. The flows are now so large that FTSE Russell has decided one June date is no longer enough: from 2026 the Russell reconstitution moves to a semi-annual schedule, adding a second event each November. The provider is not shrinking the event, it is splitting it because the event has grown operationally unwieldy. Critically for participants positioned around rebalancing mechanics, this change does not reduce the opportunity – it doubles the frequency of the primary annual event.

Passive Equity Flows Resilient to Rate Hikes

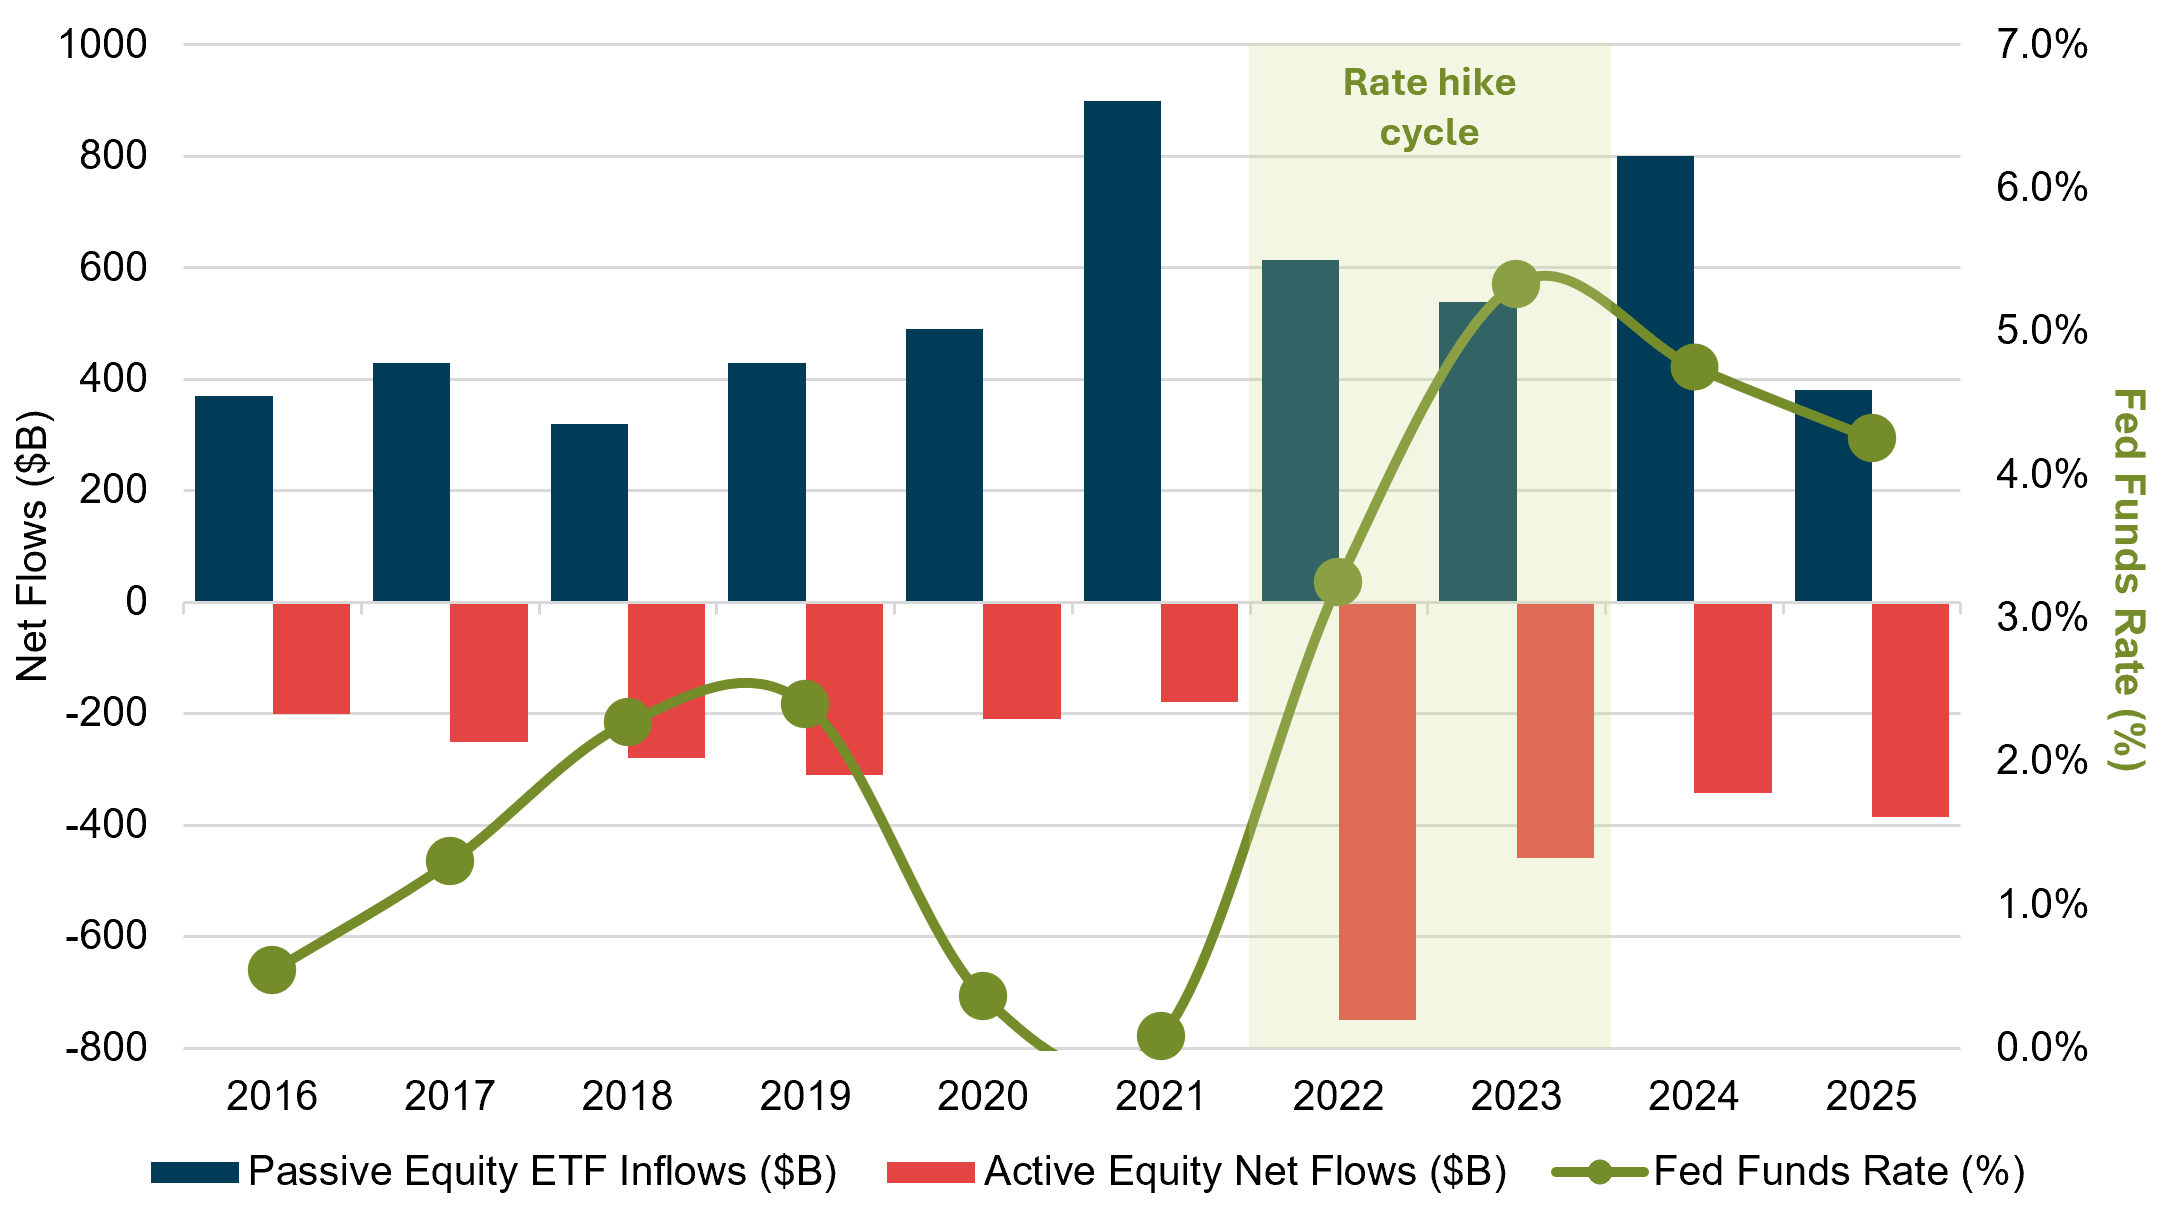
The Federal Reserve raised rates by 525 basis points between March 2022 and July 2023 – the most aggressive tightening cycle in four decades. Markets fell -19.4% in 2022. Regional bank failures sent shockwaves through the financial system in Q1 2023. In this environment, the conventional prediction was clear: passive equity funds would bleed as investors would rotate out of equities. The data contradicts every part of that prediction – passive equity net inflows continued.

Exhibit 2: Passive vs Active Flows in the Rates Cycle (2016-2025)

Source: Morningstar Direct; ICI; YCharts; Office of Financial Research; Federal Reserve H.15; Morningstar US Fund Flows Jan 2026. Passive = Equity Index Mutual Funds + ETFs. Shaded region = Fed rate-hike cycle (Mar 2022 – Jul 2023).

The reason the passive base held is structural. Auto-enrolled pension contributions arrive every month regardless of the rate environment. The fee gap between active and passive – roughly 13:1 in 2023, from 4:1 (2010) – bites harder when cash yields 5%, not less. And the performance evidence kept pointing the same way: The Morningstar Active/Passive Barometer for the 12 months to June 2025 found that only one in three active funds survived and outperformed their average passive peer – in a year characterised by elevated volatility, tariff uncertainty and geopolitical risk that should theoretically have favoured active stock-pickers. For traditional Equity allocations, the evidence for passive has not weakened, it has strengthened.

The ETF Wrapper Won, Widening the Opportunity Set

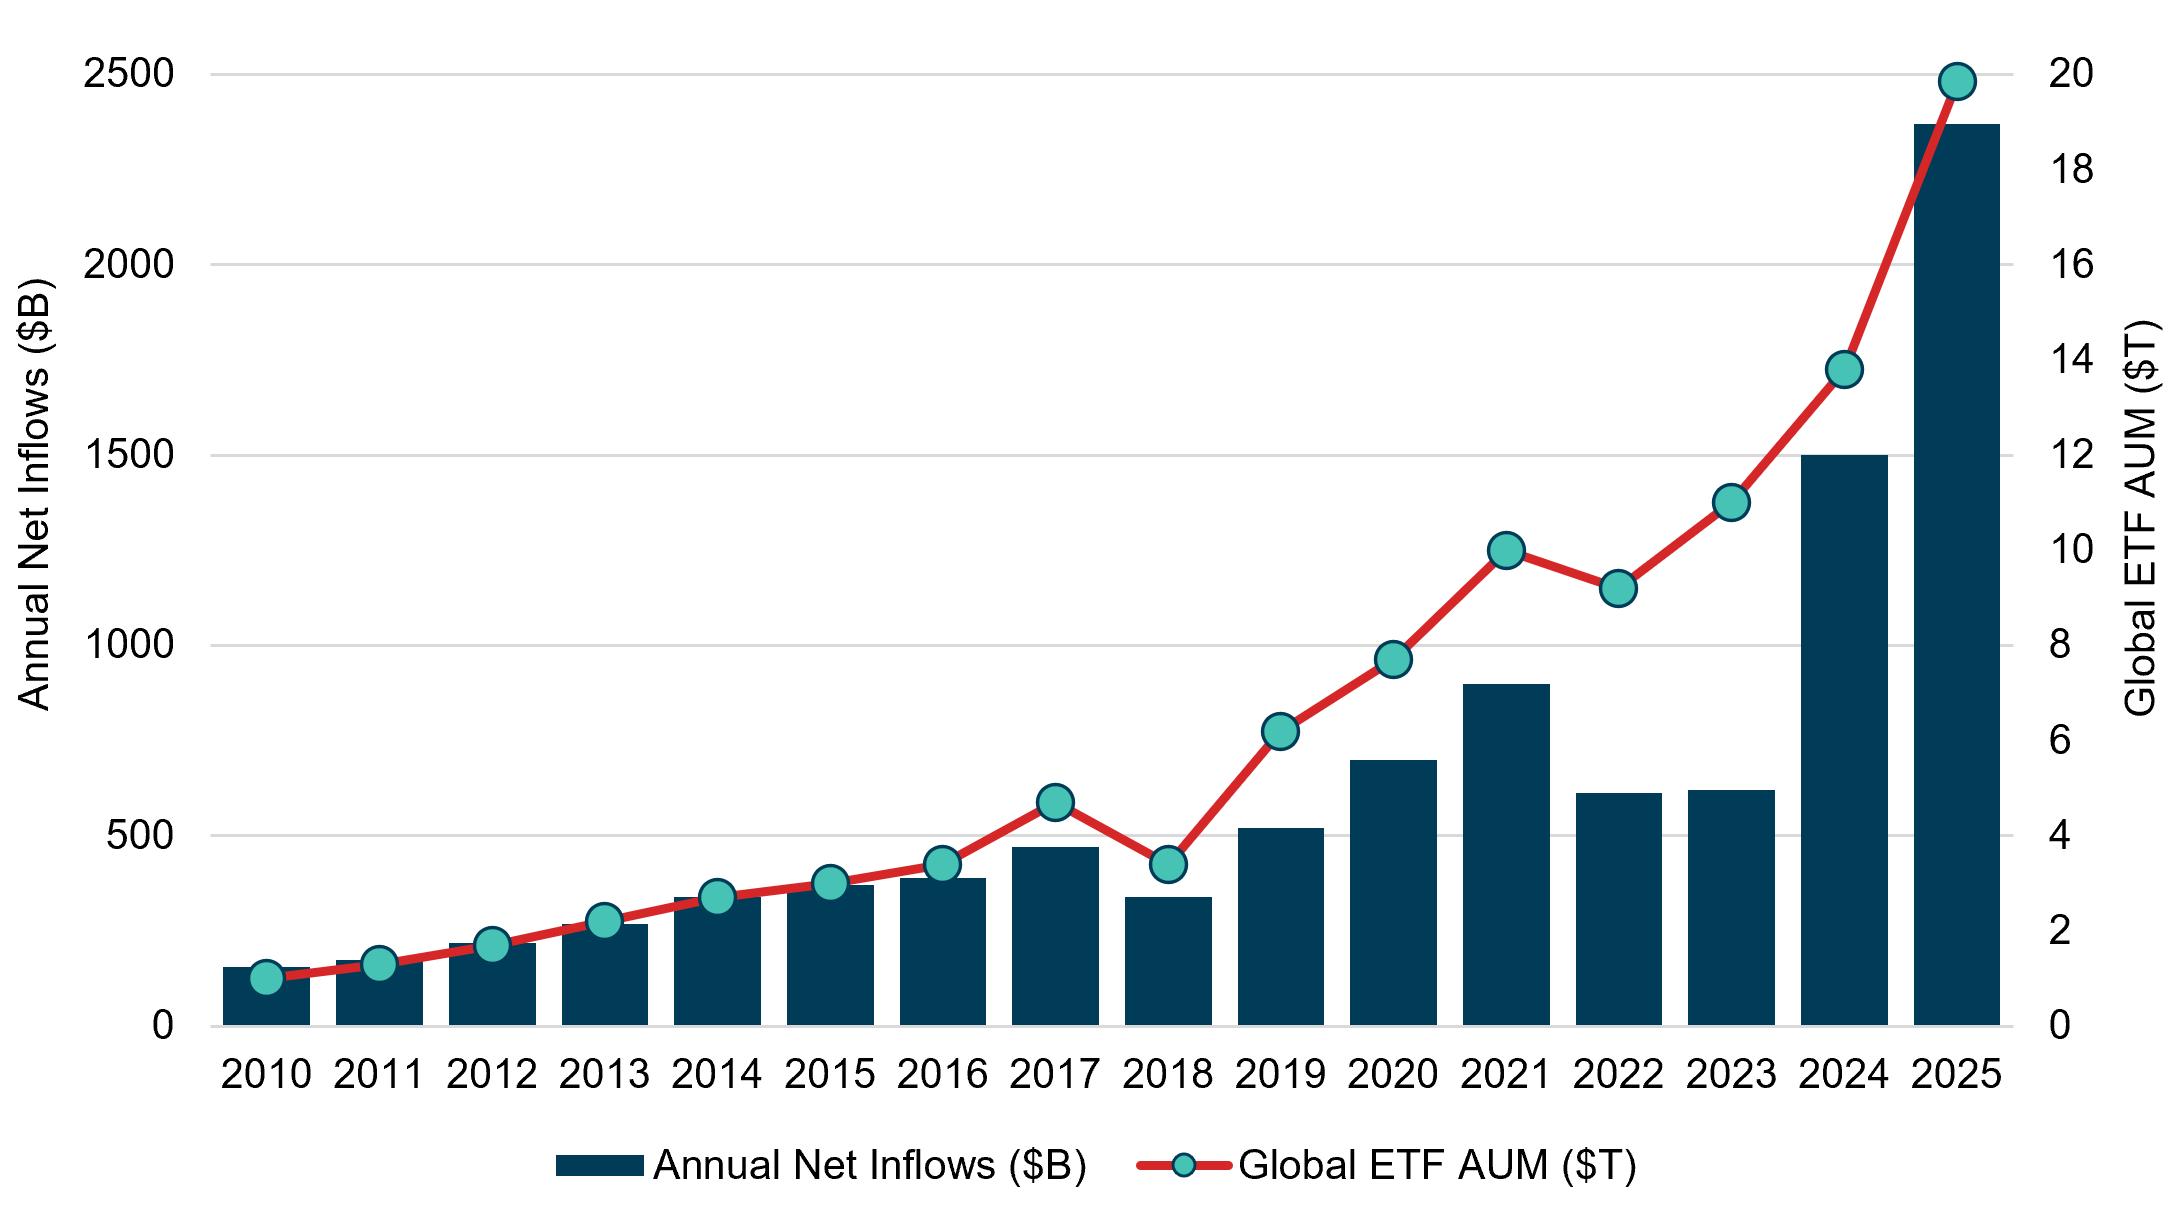
The ETF, born to deliver passive indexing, has become the wrapper for almost everything. Active managers are converting their mutual funds into ETFs to capture the wrapper’s intraday liquidity, tax efficiency and lower cost. Global ETF assets have compounded at around 20% a year since 2008, reaching roughly $19.85 trillion by end-2025. The fastest-growing corner is active ETFs, up around 59% a year over three years.

There is a second-order effect here that matters. The ETF wrapper does not just make active management cheaper and more liquid – it makes it more legible. Active ETFs trade intraday and, in the US, disclose their holdings daily. And a growing share of “active” ETFs are not discretionary at all: they run transparent, rules-based methodologies with defined selection, weighting and rebalancing schedules. Before the ETF era, those same quasi-passive strategies lived inside opaque mutual funds, and their rebalancing was invisible from the outside. Delivered in the wrapper, it becomes observable and anything that reconstitutes on a published rule is simply another predictable flow to anticipate and trade around.

Exhibit 3: Global ETF AUM and Annual Net Inflows (2010-2025)

Source: ETFGI; State Street/Morningstar Direct ETF Impact Report 2024-25; ETFGI January 2026 press release (2025 year-end data); American Century Investments Feb 2026.

The Index Provider

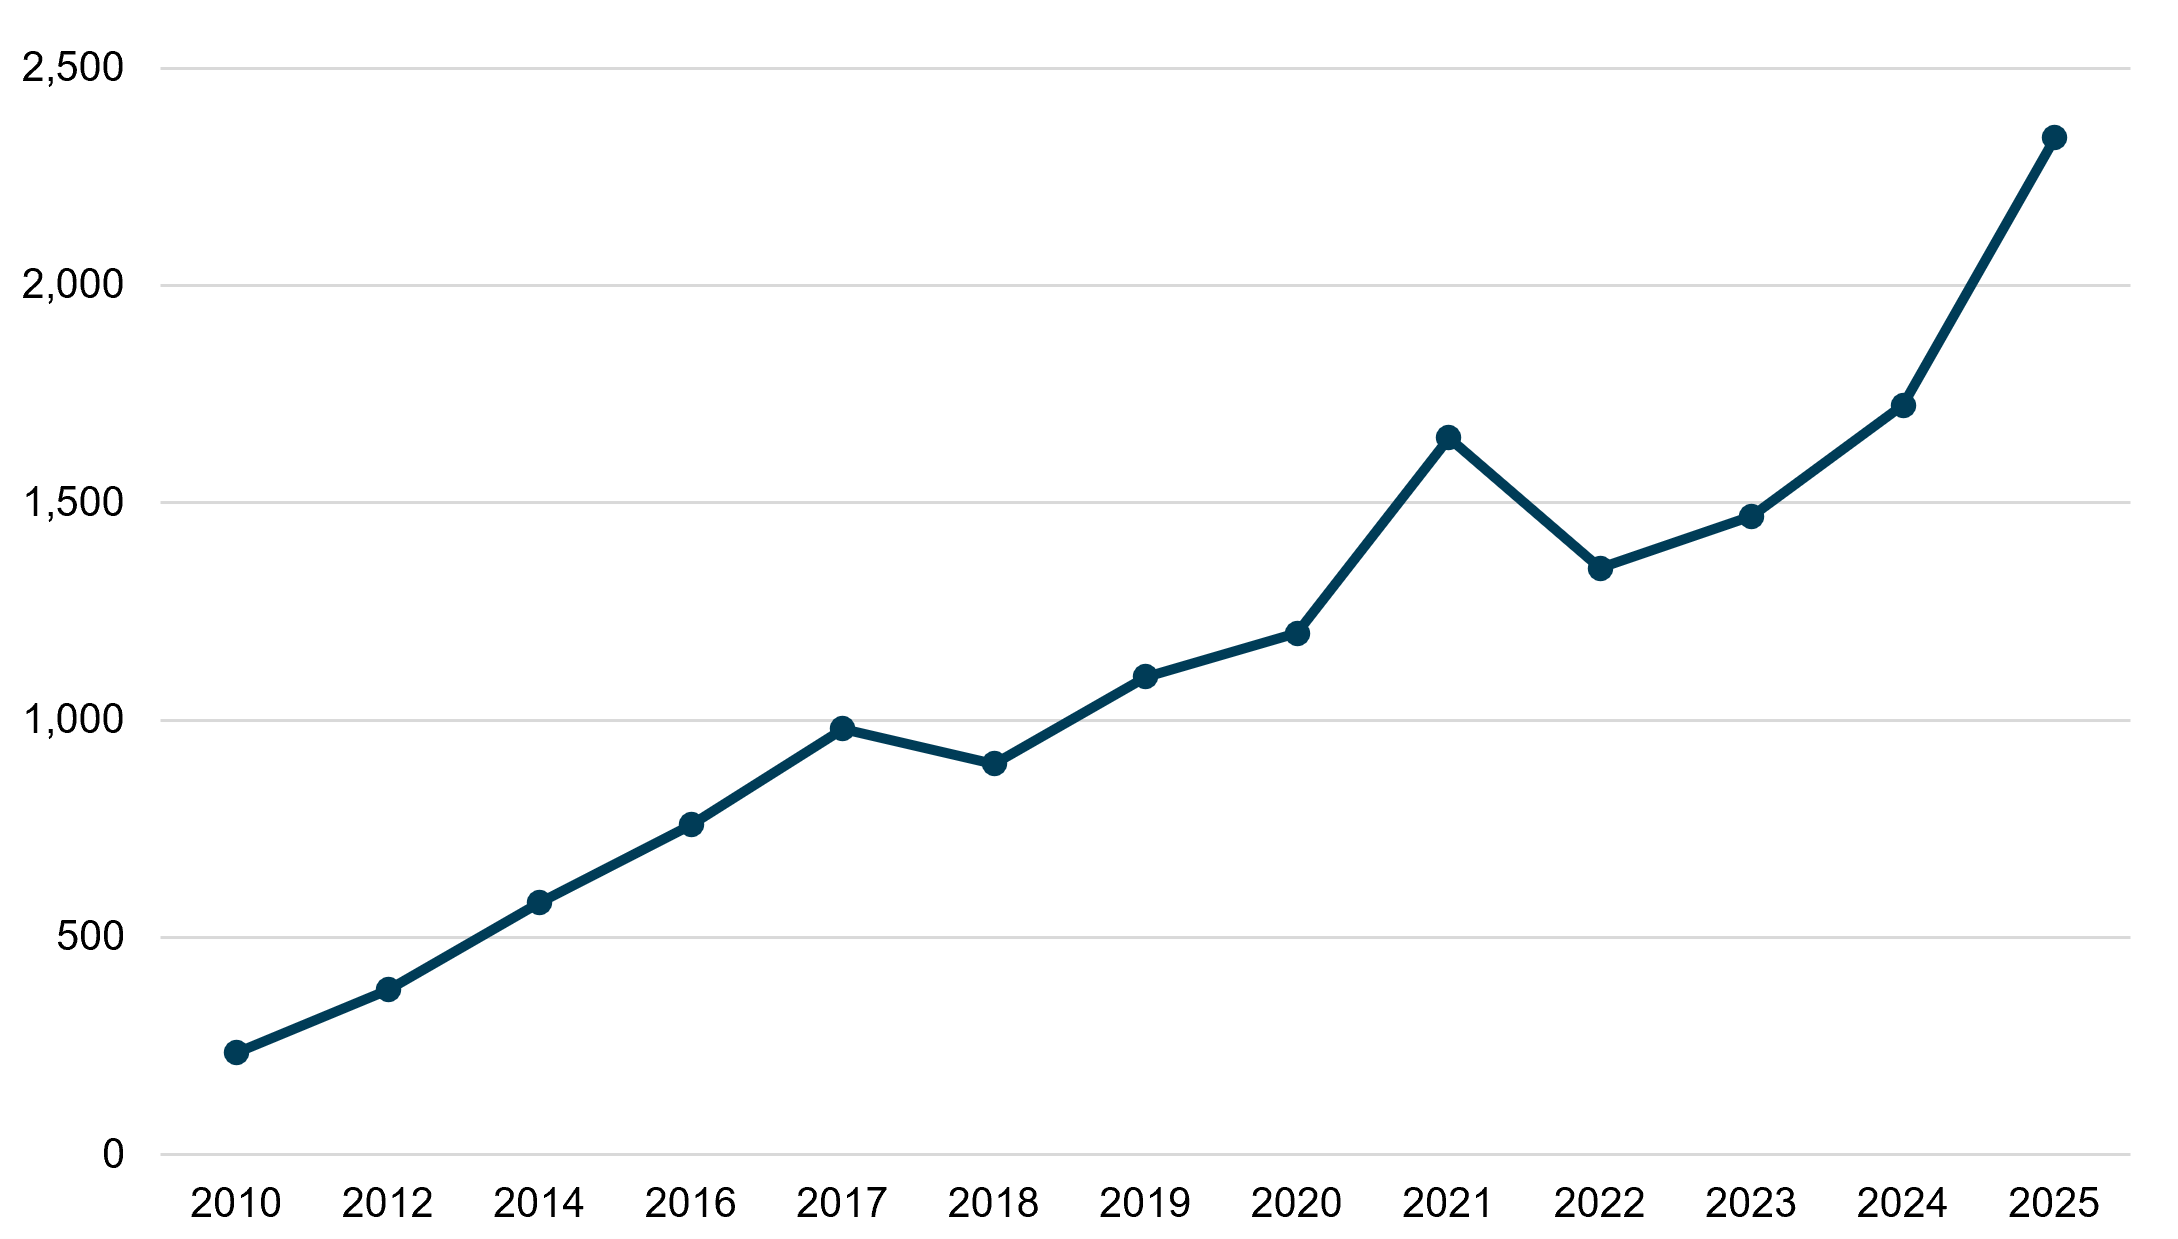
If you want the cleanest confirmation that the passive shift is structural rather than cyclical, look at the companies that sell the rules. Index providers earn fees mechanically linked to the assets benchmarked to their indices. MSCI listed in 2007 at around $2.6 billion of market value; by 2025 it was north of $43 billion. Roughly 57% of its revenue is index-related, and about 40% of that is asset-based fees tied directly to passive AUM.

Exhibit 4: ETF AUM Linked to MSCI ($B)

Source: MSCI 8-K SEC filings (2009-2025); MSCI IR monthly ETF-linked AUM series; MSCI 2023 Annual Report; Morningstar equity research.

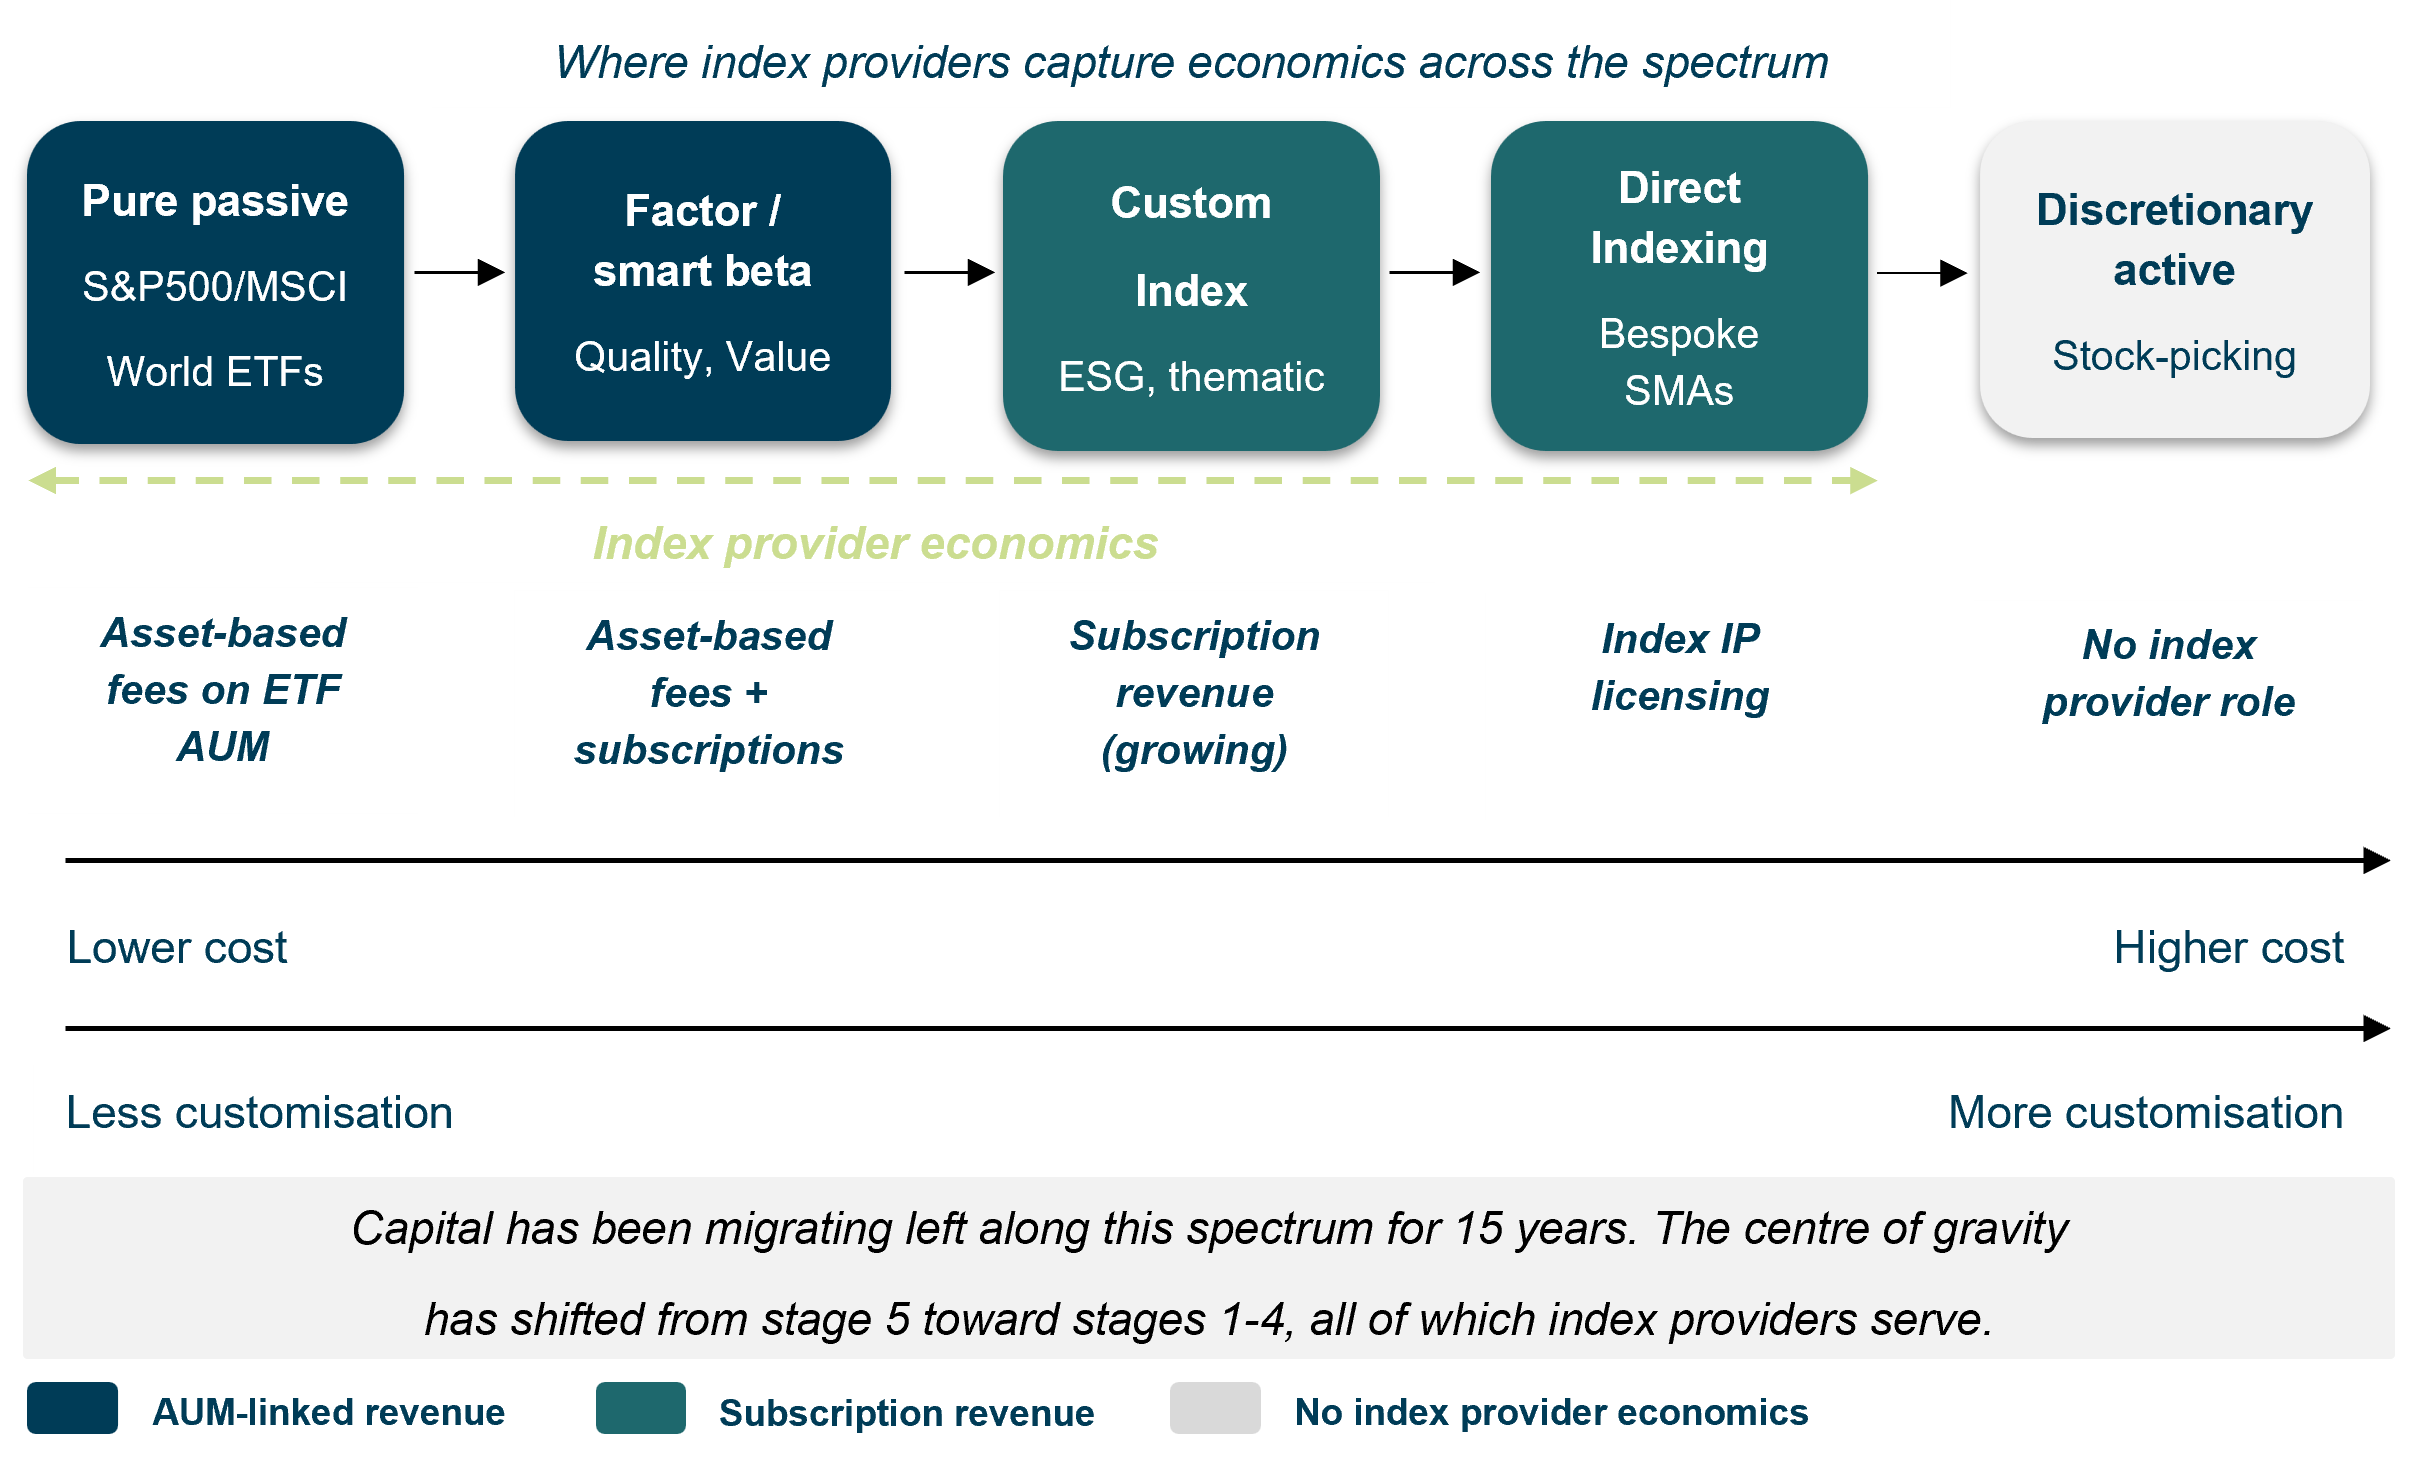
The “passive” label has quietly outgrown itself, too. S&P Dow Jones calculates more than 780,000 indices a day; against a global universe of only 40,000–50,000 listed equities. Direct indexing – owning the constituents individually in a managed account, with room for tax-loss harvesting and concentration control – has grown past $860 billion. The index has stopped being a mirror of the market and become a product in its own right: rules-based, customisable, and everywhere.

The active-to-passive spectrum is better understood as a continuum – and index providers now capture economics at every stage except discretionary stock-picking. With that the Index-Rebalance-Strategy-opportunity-set grows:

Exhibit 5: The Active-Passive Investment Continuum

Conclusion

There are three main tailwinds for Index Rebalance strategies.

1. Every percentage point that migrates from active to passive adds to the pool of capital that must rebalance mechanically at reconstitution. That pool now exceeds $40–50 trillion globally.

2. Reconstitution events are growing – in frequency (Russell moves to semi-annual in 2026), in scale ($220B traded in a single day in 2024, $102B+ through the Nasdaq Closing Cross in 0.871 seconds in 2025), and in predictability.

3. The capital executing these reconstitutions, from pure passive to quasi/semi active, is price-insensitive by construction. It must trade at the close, at scale, regardless of valuation. That structural indifference to price creates the conditions for systematic, anticipatable price dislocation.

The passive revolution has rewired how equity markets work, how products are built, and where and how the money is directed. For strategies built around the predictable mechanics of index reconstitution, that is the opportunity.

The views expressed should not be viewed as investment recommendations and are subject to change. This material is for informational purposes only and does not constitute investment advice, an offer, or a recommendation.

RELATED INSIGHTS

SIGN UP TO TRIUM TALKS
Trium Talks triangle