


• Despite all concerns, which have persisted since late May 2023, the level of liquidity in the US banking system is still around the highest level it has ever been, even during all of the quantitative easing (QE pre-2020), and is still two times more than during the repo crisis level in September 2019.
• Early termination of quantitative tightening (QT) would be a positive development for the US Treasury (UST) market, but it is likely to be preceded by a spike in front-end money market rates first.
• Historical comparisons to the only other time QT was prematurely cut, 2019, look enticing but should not be easily made, especially concerning what may happen to risky assets, like US equities.
We measure actual liquidity using commercial bank reserves balances (RBs) plus reverse repos (RRP) at the Fed. Potential liquidity should be actual liquidity plus the US Treasury General Account (TGA) at the Fed. Liquidity increases when RBs increase or when RRP decreases. In that sense, RRP acts as a potential cushion for RBs. In a similar manner, a decrease in TGA also tends to increase liquidity (and vice versa). But while RRP can go to zero, depending on what happens to various money market rates, TGA never does, and tends to vary around a target level, which currently is $750Bn – that is why we included TGA in potential liquidity and not actual.
There are two other acronyms to keep in mind when thinking about liquidity: the Standing Repo Facility (SRF) and the Bank Term Funding Program (BTFP) at the Fed. Both of these add to potential liquidity, meaning these are instruments that can be used when liquidity becomes scarce. The interesting thing about these two is that they did not exist before 2021, so yes, they were unavailable during the 2019 repo crisis.
The market started to worry about liquidity in this cycle already in late May because the US Treasury had to replenish the TGA after the debt ceiling ‘crisis’, thus taking liquidity away. What the market did not foresee back then was that if TGA increased while, at the same time, RRP decreased, in other words, money parked in money market mutual funds (MMMFs), which themselves were parked in RRP, left to buy US T-Bills, as their rates were more attractive, liquidity may not decline (previously discussed here in our blog). As a matter of fact, RBs have increased since May 2023.
There were renewed worries about liquidity at the end of last December when we saw a small spike in some money market rates, reminding some people of the events that preceded the repo crisis in September 2019. Then there were the December FOMC minutes released last week that mentioned some talk of an early termination of QT in 2024 ahead of schedule. And finally, over the weekend, there was this speech by Dallas Fed President Lorie Logan, an expert on the matter, which suggested that it might be pertinent to look at the conditions that may warrant such a move.
So, this week, the market did not know whether to rejoice because QT may be terminated earlier than expected (dovish), or be worried that liquidity is getting scarce. Well, the good news is that liquidity is still plentiful, and the situation is not like 2019 yet at all. The bad news is that the Fed is still hawkish. Indeed, in that same speech, Lorie Logan was quite explicit that it may be even warranted for the Fed to hike one more time (“In light of the easing in financial conditions in recent months, we shouldn’t take the possibility of another rate increase off the table just yet”).
Memories of 2019 resurfaced because that was the only other time the Fed had to slow down and eventually prematurely stop QT. And the similarities are uncanny: there was a similar discussion on the size of the Fed balance sheet in December 2018, then the January 2019 FOMC provided a more extended discussion on how and when to slow it down, and then the March FOMC announced that QT would be slowed down starting in May 2019, and, finally, in July QT was prematurely stopped (at which point the Fed cut rates). Some analysts predict a similar course of events in 2024.
The thing is that 2024 is nothing like 2019 when it comes to liquidity (and even more so when it comes to elevated inflation – but that is another discussion. Suffice to say that back then, the Fed did not have to worry about that, at least). The chart below shows actual liquidity divided by banks’ total assets. It has been decreasing since last summer, but at roughly 20%, it is still at the highs during all of QE and almost twice the lows that preceded the 2019 repo crisis. For that level to be reached, we not only need to have RRP go to zero but also RBs to drop by about $800bn from current levels. Of course, it is much more likely that to avoid a 2019 scenario, the Fed acts earlier than this, so we will start to worry once RRP is drained and RBs go below $3Tn.
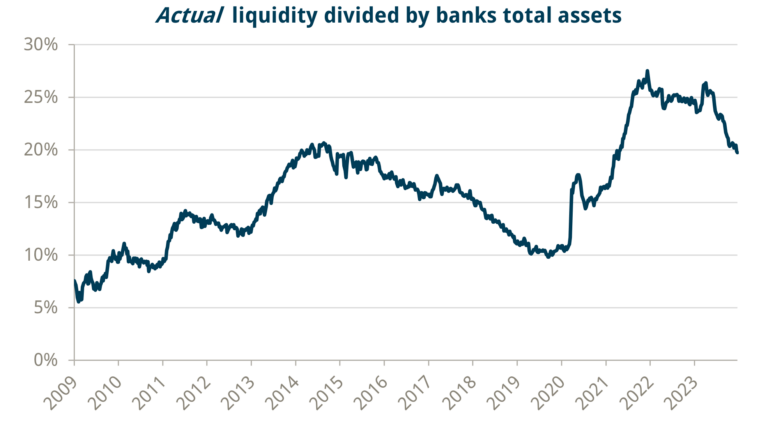
Source: Bloomberg & Trium Capital
However, before that happens, we are bound to see many warning signals. Take the difference between the Effective Fed Funds Rate (FFR) and the Interest On Reserve Balances (IORB). This spread started rising consistently in Q2 2018, and by the end of that year, it was at zero. It turned positive when the Fed announced a slowdown in QT in March 2019, climbing to the high teens before the Fed finally stopped QT and cut rates in July 2019. The spread then proceeded to climb as high as 20bps in September 2019 during the height of the crisis. Far from current levels at -7bps.
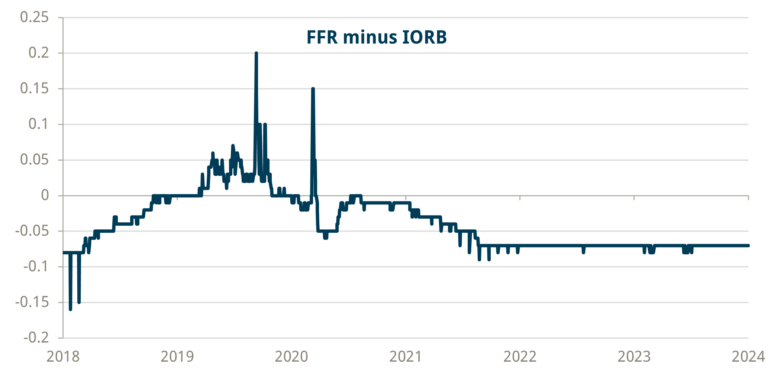
Source: Bloomberg & Trium Capital
Or take the Secured Overnight Financing Rate (SOFR) minus the Reverse Repo Rate (RRR). The spread averaged about 17bps before the September 2019 crisis. We have for sure seen some spikes in this spread recently, but for the moment, they all seem to be happening at month-end, particularly December 2023 month-end, and the last six months’ average is still about close to zero.
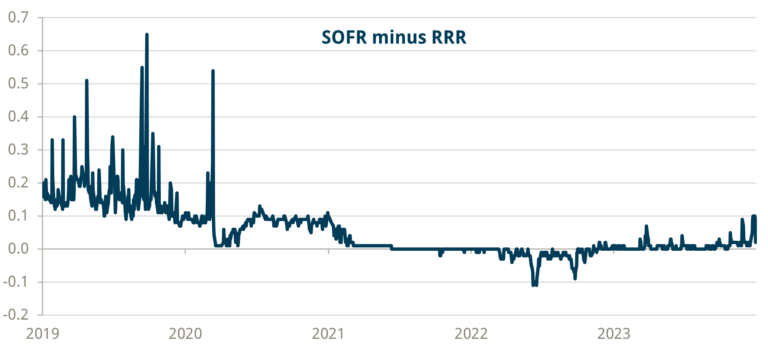
*The chart omits the spike on Sept.17, 2019 for clarity, otherwise it would be too difficult to read.
Source: Bloomberg & Trium Capital
And do not forget that in 2019, we did not have SRF and BTFP. We are unsure what will happen to the latter, given that it expires soon. Apart from small episodic use during the March 2023 regional bank crisis, it has been used only for arb purposes as front end money market rates have collapsed on account of the interest rate cuts being priced in. Still, the former has the potential to be another source of liquidity once RRP is drained completely.
So, will QT prematurely end? We think it depends on how fast RRP is drained and how fast RBs decline as a result. An early QT end will reduce the amount of USTs the private sector will have to buy (less of a passive runoff). Then, once QT ends, any paydown from the Fed’s mortgage portfolio will be reinvested in USTs (or T-Bills). So, there is a secondary (positive) effect on UST/T-Bill demand from this. Overall, this should be welcomed by the UST market.
What about risky assets? They tend to move more on real rates than nominal ones. If we use the S&P 500 Index as a proxy for risky assets, it had a very good 2019 because real rates dropped by almost 100bps to close to zero, while currently they are still closer to 2%. Of course, there are a myriad of other things that affect risky assets, not the least starting valuations (and here, current US equities do not seem attractive at a forward P/E ratio of approaching 20, when at the end of 2018, that ratio was hitting 14).